


Abstract
Background: Skin cutaneous melanoma (SKCM) is a highly aggressive cancer with significant mortality, necessitating novel prognostic markers and therapeutic strategies. Centrosome amplification (CA), a hallmark of genomic instability, contributes to cancer progression, but its role in SKCM remains unclear.
Methods:Transcriptomic data from SKCM patients were analyzed to identify differentially expressed genes (DEGs) between SKCM and normal tissues. Centrosome amplification-related genes (CA-RGs) were selected based on centrosomal functions. Prognostic CA-RGs were identified using Cox regression and LASSO analyses, resulting in a CA-RG-based risk model. Single-cell RNA sequencing (scRNA-seq) was employed to investigate cellular mechanisms, and immune infiltration analyses were conducted to assess CA-RGs’ impacts on the tumor microenvironment.
Results: Four CA-RGs (CDK2, KAT2B, NUBP1, CEP120) were identified as prognostic markers. A risk model effectively stratified patients by survival outcomes and was validated in external datasets. Immune infiltration analysis showed that low-risk patients had higher immune and stromal scores, with increased CD8+ T cells and M1 macrophages. ScRNA-seq analysis revealed interactions among fibroblasts, keratinocytes, and malignant cells, indicating CDK2 and KAT2B may promote tumor progression through intercellular signaling.
Conclusions:This study identifies novel CA-RGs and establishes a robust risk model for SKCM prognosis. Insights into the immune microenvironment and intercellular interactions provide a foundation for targeted therapies, including immunotherapy, offering potential strategies for improving SKCM management.
Keywords:SKCM, centrosome amplification, immune infiltration, prognosis, therapy prediction
Introduction
Melanoma is a highly malignant and aggressive skin cancer that metastasizes early through lymphatic or hematogenous routes, leading to poor prognosis[1] . Despite accounting for only 2% of all skin cancers, melanoma has the highest mortality rate among them. Globally, Skin Cutaneous Melanoma (SKCM) accounts for more than 80% of deaths related to skin cancer annually, making it one of the most lethal cancers threatening human health. Both the incidence and mortality rates of SKCM have steadily increased over the past few decades, with a growing prevalence among younger populations[2] . Originating from melanocytes in the skin's basal layer, SKCM is highly invasive and ranks as the fourth leading cause of cancer-related deaths worldwide[2] . SKCM can be classified into benign tumors, primary malignant tumors, and metastatic melanoma. The five-year survival rate for patients with primary melanoma exceeds 95%, while those with metastatic melanoma rarely survive beyond one year[3] . Surgical resection is the primary treatment for early-stage SKCM, but advanced cases present significant challenges, often requiring radiotherapy and chemotherapy. Early detection through biomarkers is crucial for improving outcomes. Despite progress in diagnosing and prognosticating SKCM using markers like BRAF and NRAS mutations and immune checkpoints such as PD-L1, identifying additional molecular characteristics for advanced SKCM remains a challenge[4] .
The centrosome, a critical organelle in human cells, serves as the microtubule-organizing center in animal cells and is composed of two orthogonal centrioles embedded in the pericentriolar material (PCM). It plays an essential role in cellular processes, including signal transduction, cell polarity, division, and migration[5] . Defects in centrosome structure and function are associated with cancer. The most common defect is centrosome amplification (CA), which refers to the presence of more than two centrosomes or abnormally large centrosomes in a cell, including numerical and structural amplification[6] . Numerous studies have identified CA as a hallmark of cancer, often linked to abnormal tumor karyotypes and poor clinical outcomes. Mechanistically, CA impairs mitotic fidelity, leading to chromosomal instability, which underpins tumor initiation and progression [7] . Studies have indicated that CA is associated with the excessive replication of centrioles in human melanoma[8] . However, research into the molecular mechanisms of CA in melanoma remains limited. Identifying the genetic mechanisms underlying centrosome amplification-related genes (CA-RGs) in SKCM will contribute to understanding the mechanisms driving this cancer’s development.
This study employs SKCM transcriptome data and CA-RGs to conduct bioinformatics analyses, aiming to identify prognostic markers and elucidate their molecular mechanisms, thereby offering new perspectives for SKCM treatment..
Materials and Methods
Analysis of gene expression differences between SKCM and normal skin tissues
To identify differentially expressed genes (DEGs) between SKCM and non-tumor tissues, we downloaded gene transcriptome data and clinical information from the GEO dataset GSE15605 (https://www.ncbi.nlm.nih.gov/geo/database). The dataset comprises 58 SKCM samples and 16 normal skin tissue samples. Differential expression analysis was performed using the R package limma [9] . DEGs were filtered based on the criteria of P < 0.05 and |log2FC| > 0.05. A volcano plot was generated using the R package ggplot2 [10] , and a heatmap was created using the R package pheatmap [11] .
Identification of centrosome amplification-related genes in SKCM and functional analysis
To identify differentially expressed centrosome amplification-related genes (CA-RGs) in SKCM tissues, we obtained a set of 76 CA-RGs from the Gene Ontology database (http://geneontology.org/). The intersection of these genes with the differentially expressed genes identified in SKCM provided the differentially expressed CA-RGs. A Venn diagram was created using the R package ggvenn[12] . Next, Gene Ontology (GO) and Kyoto Encyclopedia of Genes and Genomes (KEGG) enrichment analyses were conducted on these CA-RGs using the R package clusterProfiler[13] to identify potential functional pathways involved in melanoma development. A pentagon bubble plot was generated using the R package ggplot2[10] , and a chord diagram was created with the R package GOplot[14] . Additionally, to explore the protein-protein interaction (PPI) network among the differentially expressed CA-RGs, we used the STRING database (https://cn.string-db.org/) with a confidence score >0.4, and visualized the interaction network using Cytoscape software[15] .
Construction and validation of centrosome amplification-related risk models
To construct a risk model based on the differentially expressed CA-RGs, we downloaded the GDC TCGA-SKCM dataset from the UCSC Xena database (https://xena.ucsc.edu/), which includes gene expression data, clinical information, and survival data for 457 SKCM samples. First, we conducted univariate Cox regression analysis using the R package survival[16] , selecting genes with P < 0.05 as input features for LASSO Cox regression. The R package glmnet [17] was used to fit a generalized linear model with penalized maximum likelihood, applying L1 regularization to remove features with a penalty score of 0. The remaining non-zero features were identified as candidate genes for constructing the risk model. To ensure the validity and reliability of the Cox regression model, we tested the proportional hazards (PH) assumption for the candidate genes using the R package survival. Genes with P > 0.05 were considered to pass the PH test. Next, we performed multivariate Cox regression on the genes that passed the PH test, using the step function for stepwise Cox regression to identify prognostic genes. The regression coefficients for each gene were obtained from the model. A forest plot displaying the results of the univariate and multivariate Cox regression analyses was generated using the R package forestplot[18] .The risk score for each sample in the TCGA-SKCM cohort was calculated using the following formula: Risk score = ∑ Exp (mRNA) ∗ Coef (mRNA), where Exp represents the mRNA expression level of each prognostic gene, and Coef represents the corresponding Cox regression coefficient. The 457 samples in the TCGA-SKCM cohort were divided into high-risk and low-risk groups based on the optimal cut-off value of the risk score. The distribution of risk scores and survival status of the samples were visualized using the R package ggplot2. We then compared the survival probabilities between the high-risk and low-risk groups using the R package survival and plotted Kaplan-Meier survival curves with the R package survminer[19] . Receiver operating characteristic (ROC) curves were generated with ggplot2, and the area under the curve (AUC) for 1-year, 3-year, and 5-year survival was estimated using the R package survivalROC[20] to assess the sensitivity and specificity of the risk model. A heatmap showing the expression of prognostic genes across TCGA-SKCM samples was created with the R package pheatmap. To validate the robustness and effectiveness of the risk model, we downloaded an independent SKCM dataset, GSE100797, from the GEO database (https://www.ncbi.nlm.nih.gov/geo/database), which includes gene expression data and survival information for 25 SKCM samples.
Construction and evaluation of prognostic models
To evaluate the prognostic capability of combining risk scores with clinical factors, we constructed a prognostic model in the TCGA-SKCM cohort. First, we used the Wilcoxon test or Kruskal-Wallis test to assess differences in risk scores across six clinical subgroups: age, sex, stage, T stage, N stage, and M stage. A P value < 0.05 was considered statistically significant, and the results were visualized as boxplots using the R package ggplot2. We then analyzed the survival differences between high-risk and low-risk patients within subgroups showing significant differences in risk scores. Next, univariate Cox regression analysis was performed based on risk scores, age, sex, stage, T stage, N stage, and M stage in the TCGA-SKCM cohort. Factors with P < 0.05 were subjected to the proportional hazards (PH) assumption test, and those with P > 0.05 were included in the multivariate Cox regression model. Factors with P < 0.05 in the multivariate analysis were incorporated into the final prognostic model. The R package survival was used for survival analysis, univariate Cox regression, PH assumption testing, multivariate Cox regression, and model construction. Kaplan-Meier survival curves were plotted using survminer, while forest plots were generated using forestplot to display the results of both univariate and multivariate Cox analyses. A nomogram was drawn using the R package regplot[21] .Subsequently, we assessed the performance of the prognostic model using calibration curves, ROC curves, and decision curve analysis (DCA). Model calibration was performed using the R package rms[22] . The specificity and sensitivity of the ROC curves were computed with timeROC [23] , and decision curve data were calculated using ggDCA[24] .
Gene set enrichment analysis
To further explore the biological pathways involving prognostic genes, we first calculated the Spearman correlation coefficients between genes in the TCGA-SKCM cohort and ranked the genes based on these coefficients. Next, KEGG pathway enrichment analysis was conducted using the R package clusterProfiler, with significance thresholds set at p.adjust < 0.05 and |NES| > 1. The top five most significantly enriched pathways were visualized using the R package enrichplot.
Functional enrichment analysis
To investigate pathway alterations between the high- and low-risk groups in the TCGA-SKCM cohort, we used Gene Set Variation Analysis (GSVA) to estimate the biological functions and signaling pathways of the prognostic genes. Specifically, molecular hallmark scores were calculated for each patient using the Hallmarks database in the R package GSVA[25] . Differential pathway analysis between the high- and low-risk groups was performed using the R package limma. All pathways were visualized using ggplot2, with P < 0.05 considered statistically significant.
Immune infiltration analysis
To investigate immune cell infiltration in SKCM, we used the R package xCell[26] to calculate infiltration scores for 34 types of immune cells in the TCGA-SKCM cohort. Differences in cell scores between high- and low-risk groups were compared, with cells showing P < 0.05 identified as significantly different. The correlations between these different immune cells and their associations with risk scores were also analyzed. ggplot2 was used to visualize cell infiltration scores as bar plots and correlation lollipop charts, while ggpubr[27] was used to generate box plots for differential analysis. Additionally, corrplot[28] was employed to display correlation heatmaps. To further analyze the relationship between immune and stromal cell infiltration and prognostic genes across the high- and low-risk groups, we first calculated immune, stromal, and composite scores for each sample in the TCGA-SKCM cohort using the R package estimate[29] . Differences in scores between the two risk groups were then compared, and the Spearman correlation coefficients between these scores and risk scores were calculated. The ggplot2 package was used to generate violin plots for differential score analysis and scatter plots for correlation analysis.
Analysis of immune response capacity and immune status
To assess immune response capacity and immune status between high- and low-risk groups, we first downloaded melanoma clinical data from the TCIA database (https://tcia.at/home) and extracted patients’ Immune Phenotype Scores (IPS). The IPS differences between the high- and low-risk groups in the TCGA-SKCM cohort were then compared. Additionally, we extracted 42 immune checkpoints from the literature (PMID: 37215879) and compared the expression levels of these immune checkpoints between the high- and low-risk groups in the TCGA-SKCM cohort. The ggplot2 package was used to generate violin plots to visualize differences in IPS scores and box plots for immune checkpoint expression differences.
Drug sensitivity analysis
To evaluate the sensitivity of SKCM patients to common chemotherapeutic agents, we utilized the GDSC database (https://www.cancerrxgene.org/) to predict the half-maximal inhibitory concentration (IC50) values for 198 chemotherapeutic and targeted therapy drugs in the TCGA-SKCM cohort. Using the pRRophetic package[30] , we compared the IC50 values between high- and low-risk groups for each drug. The most significant differences in IC50 values were visualized using violin plots generated with the ggplot2 package.
Somatic variants analysis
To investigate the differences in gene mutations between high- and low-risk groups, we utilized the TCGAmutations package[31] to download somatic mutation data for melanoma. Subsequently, we employed the maftools package[32] to generate waterfall plots depicting the top 20 most frequently mutated genes in the TCGA-SKCM cohort for both risk groups.
Analysis of prognostic genes regulatory mechanisms
To further explore the interaction between prognostic genes and other genes or elements, we first accessed the miRNet database (https://www.mirnet.ca/) to identify transcription factors (TFs) targeting the prognostic genes. We selected the JASPAR database to construct a TF-gene regulatory network. Subsequently, we utilized the GeneMANIA database (https://genemania.org/) to identify genes associated with the prognostic genes, examining their interactions, including protein-protein, protein-DNA, and genetic interactions, as well as pathways, reactions, gene and protein expression data, and protein domain information. The interaction network and the TF-gene regulatory network were visualized using Cytoscape software.
Single-cell transcriptome sequencing analysis
To analyze the expression distribution of prognostic genes at the single-cell level, we used the single-cell dataset GSE215120 to explore SKCM pathogenesis. Raw data from three SKCM samples were downloaded from the GEO database (https://www.ncbi.nlm.nih.gov/geo/). Cells were filtered based on UMI counts (<500 or >20,000), mitochondrial content (>20%), and features (<200 or >6,000). Data normalization was performed using the NormalizeData function (scale factor=10,000), and variable genes were identified using the FindVariableGenes function (vst method; top 2,000 features). Features were normalized and centered using the ScaleData function. Principal component analysis (PCA) was conducted using the RunPCA function (50 principal components retained), with significance assessed via the JackStraw function. Cell clusters were identified using the FindClusters function (SNN modular optimization; resolution=0.8), and dimensionality reduction was performed with the RunTSNE function, visualized using DimPlot. Clusters were annotated using the CellMarker 2.0 database and manually curated marker genes. The top three cell types with the highest expression of prognostic genes were identified as key cells. All analyses were performed using the Seurat package[33] . To explore receptor-ligand interactions, we referenced the CellChatDB.human database and inferred interactions using the CellChat package[34] . The c Communication networks were visualized with network diagrams and heatmaps. Signaling pathways were inferred using the netAnalysis_computeCentrality function, and signal senders/receivers were visualized with the netAnalysis_signalingRole_scatter function. Pseudotime analysis was conducted using the monocle package[35] to assess dynamic changes in key cells. Cell trajectories were displayed using the plot_cell_trajectory function, while prognostic gene expression changes were visualized with the plot_genes_branched_heatmap and plot_genes_in_pseudotime functions.
Analysis of prognostic genes expression
To analyze the expression of prognostic genes, we first compared the transcriptomic expression differences between SKCM tissues and normal skin tissues in the dataset GSE15605, using the ggplot2 package to present the results as boxplots. To validate gene expression at the protein level, we downloaded immunofluorescence images of prognostic genes from the HPA database (https://www.proteinatlas.org/) for normal skin melanocytes and melanoma cells, and we compared the protein staining intensity between the groups.
Results
Analysis of gene expression differences between SKCM and normal skin tissues
We identified a total of 6,399 differentially expressed genes, comprising 3,527 upregulated genes and 2,872 downregulated genes and presents the expression levels of the top 10 upregulated and downregulated genes (Supplementary Figure 1).
Identification of centrosome amplification-related genes in SKCM and functional analysis
We intersected the previously identified 6,399 differentially expressed genes with 76 CA-RGs, yielding 17 differentially expressed CA-RGs for further analysis (Supplementary Figure 2A). The results of the GO annotation indicated that these genes were markedly augmented in the centrosomal functions and pathways, including centrosome duplication, centrosome cycle, centriole assembly, microtubule organizing center organization, and tubulin binding (Supplementary Figure 2B-D). As evidenced by the KEGG enrichment analysis, these genes were mostly correlated with pathways of cell cycle (Supplementary Figure 2E). To investigate the protein-protein interaction (PPI) relationships among the differentially expressed CA-RGs, we constructed a PPI network using the STRING database (Supplementary Figure 2F).
Construction and validation of centrosome amplification-related risk models
To construct a risk model for centrosome amplification-related genes (CA-RGs) in SKCM, we performed univariate Cox regression analysis on the TCGA-SKCM cohort using 17 differentially expressed CA-RGs. This identified 7 survival-associated genes (P < 0.05): CDK2, RTTN, KAT2B, PKD2, CCP110, NUBP1, and CEP120. CDK2 and RTTN were risk factors (HR > 1), while KAT2B, PKD2, CCP110, NUBP1, and CEP120 were protective factors (HR < 1) (Figure 1A). LASSO Cox regression with 10-fold cross-validation refined the model to 6 genes: CDK2, RTTN, KAT2B, PKD2, NUBP1, and CEP120 (Figure 1B). All 6 genes met the proportional hazards assumption (P > 0.05) (Supplementary Table 1). Multivariate and stepwise Cox regression analyses further narrowed the model to 4 prognostic genes: CDK2, KAT2B, NUBP1, and CEP120. Although CEP120 was not significantly associated with survival, all 4 genes were retained as essential features based on stepwise regression. These genes were used to calculate the risk score, forming the final risk model (Figure 1C).
Figure 1 Identification of prognosis-related centrosome amplification-related genes. (A) Forest plot of univariate Cox regression analysis. (B) LASSO Cox analysis for CA-RGs from univariate Cox regression. (C) Forest plot of multivariate Cox regression analysis.
Based on the optimal cutoff value of the risk score (1.340736), patients were stratified into high-risk (n = 374) and low-risk (n = 83) groups. Survival analysis revealed significantly lower survival probabilities in the high-risk group (P < 0.0001) (Figure 2A). ROC curve analysis yielded AUC values of 0.6, 0.61, and 0.63 for 1-year, 3-year, and 5-year survival, respectively (Figure 2B). Risk score distribution and survival status (Figure 2C, D) showed more patients and deaths in the high-risk group. A heatmap of prognostic gene expression (Figure 2E) indicated higher CDK2 expression in the high-risk group, while KAT2B, NUBP1, and CEP120 were downregulated.
To validate the risk model's adaptability and stability, we recalculated risk scores for patients in the GSE100797 cohort. Using the optimal cutoff (-1.674684), patients were stratified into high-risk (n = 13) and low-risk (n = 12) groups. The Kaplan-Meier (KM) curve showed significantly lower survival probabilities in the high-risk group (P = 0.026) ( Figure 2F). ROC curve analysis yielded AUC values of 0.61, 0.67, and 0.67 for 1-year, 3-year, and 5-year survival, respectively (Figure 2G). The risk scores and survival status of patients were visualized in Figure 2H, I. The heatmap confirmed higher CDK2 expression in the high-risk group and lower expression of KAT2B, NUBP1, and CEP120 (Figure 2J).
Figure 2 The prognostic value of the centrosome amplification-related genes for skin cutaneous melanoma (SKCM) patients. (A, F) Kaplan–Meier curve of overall survival (OS) between high- and low-risk groups in The Cancer Genome Atlas (TCGA) cohort and Gene Expression Omnibus (GEO) cohort (GSE100797). (B, G) The predictive value of the prognostic CA-RGs measured by receiver operating characteristic (ROC) curves at 1, 3, and 5 years in the TCGA cohort and GSE100797 cohort. (C-E, H-J) The distribution of the risk score, survival status and heatmap visualizing the expression of 4 prognostic CA-RGs in the TCGA cohort and GSE100797 cohort.
Construction and evaluation of prognostic models
To evaluate the prognostic capability of the risk score alongside clinical factors, we constructed a prognostic model using the TCGA-SKCM cohort. Differences in risk scores across six clinical factors—age, sex, stage, T stage, N stage, and M stage—were assessed using Wilcoxon or Kruskal-Wallis tests. Significant differences were observed in T stage (P < 0.05) ( Supplementary Figure 3A-F). Survival analysis within T stage subgroups revealed significantly lower survival in the high-risk group of the T3/T4 subgroup compared to the low-risk group (Supplementary Figure 3 G, H).
Next, univariate Cox regression analysis was performed on the risk score, age, sex, stage, T stage, N stage, and M stage in the TCGA-SKCM cohort. Risk score, age, stage, T stage (excluding T2), N stage, and M stage were significantly associated with survival (HR > 1), indicating they are risk factors (Figure 3A). A proportional hazards (PH) assumption test confirmed that risk score, age, stage, N stage, and T stage met the assumption (P > 0.05). Multivariate Cox regression analysis revealed that risk score, N stage, and T stage (excluding T2) were significantly associated with survival and served as risk factors (Figure 3B). These three factors were integrated into a prognostic model to predict 1-year, 3-year, and 5-year survival probabilities. A nomogram was constructed to visualize the model, predicting survival probabilities for a patient with a total score of 129 based on their risk score, T stage, and N stage. The predicted probabilities were 0.968 (1-year), 0.795 (3-year), and 0.675 (5-year) (Figure 3C).
To evaluate the prognostic model’s performance, we generated a calibration curve, ROC curve, and decision curve analysis (DCA). The calibration curve showed close agreement between predicted and observed values (Figure 3D). The ROC curve achieved AUC values of 0.79, 0.79, and 0.75 for 1-year, 3-year, and 5-year predictions, respectively (Figure 3E-G). The DCA curve revealed that the prognostic model yielded the highest net benefit (Figure 3H).
Figure 3 Establishment of the clinical nomogram. (A, B) Forest plot of the univariate Cox regression analysis and multivariate Cox regression analysis containing signature-based risk score and clinical factors. (C) Nomogram for predicting 1, 3 and 5 year overall survival (OS) of skin cutaneous melanoma (SKCM) patients in The Cancer Genome Atlas (TCGA) cohort. (D) Calibration curves of the nomogram predicted the probability of the 1, 3 and 5 year OS in TCGA dataset. The x-axis shows nomogram-predicted probability of survival, and the y-axis shows actual survival. (E-G) Multi-index receiver operating characteristic (ROC) curves of the nomogram and other clinical factors for 1, 3 and 5 year risk. (H) Decision curve analysis (DCA) of the nomogram and other clinical indicators for 1, 3 and 5 year risk.
Gene set enrichment analysis and functional enrichment analysis
We conducted independent Gene Set Enrichment Analysis (GSEA) for each gene, identifying the top five significantly enriched pathways. For CDK2, 193 pathways were enriched, with the top five being oxidative phosphorylation, lysosome, complement and coagulation cascades, cytokine-cytokine receptor interaction, and neuroactive ligand-receptor interaction (Supplementary Figure 4A). For KAT2B, 50 pathways were enriched, including autophagy (animal), phosphatidylinositol signaling system, T cell receptor signaling pathway, alcoholic liver disease, and NOD-like receptor signaling pathway (Supplementary Figure 4B). NUBP1 analysis revealed 143 pathways, with the top five being viral protein interaction with cytokine and cytokine receptor, graft-versus-host disease, allograft rejection, hematopoietic cell lineage, and systemic lupus erythematosus (Supplementary Figure 4C). For CEP120, 99 pathways were enriched, including nucleocytoplasmic transport, ubiquitin-mediated proteolysis, Polycomb repressive complex, biosynthesis of amino acids, and Vibrio cholerae infection (Supplementary Figure 4D).
We employed Gene Set Variation Analysis (GSVA) to estimate the biological functions and signaling pathways of prognostic genes, using Hallmarks as the background gene set. We identified 34 differential pathways, with 20 pathways upregulated and 14 pathways downregulated in the high-risk group (Supplementary Figure 4E).
Immune infiltration analysis
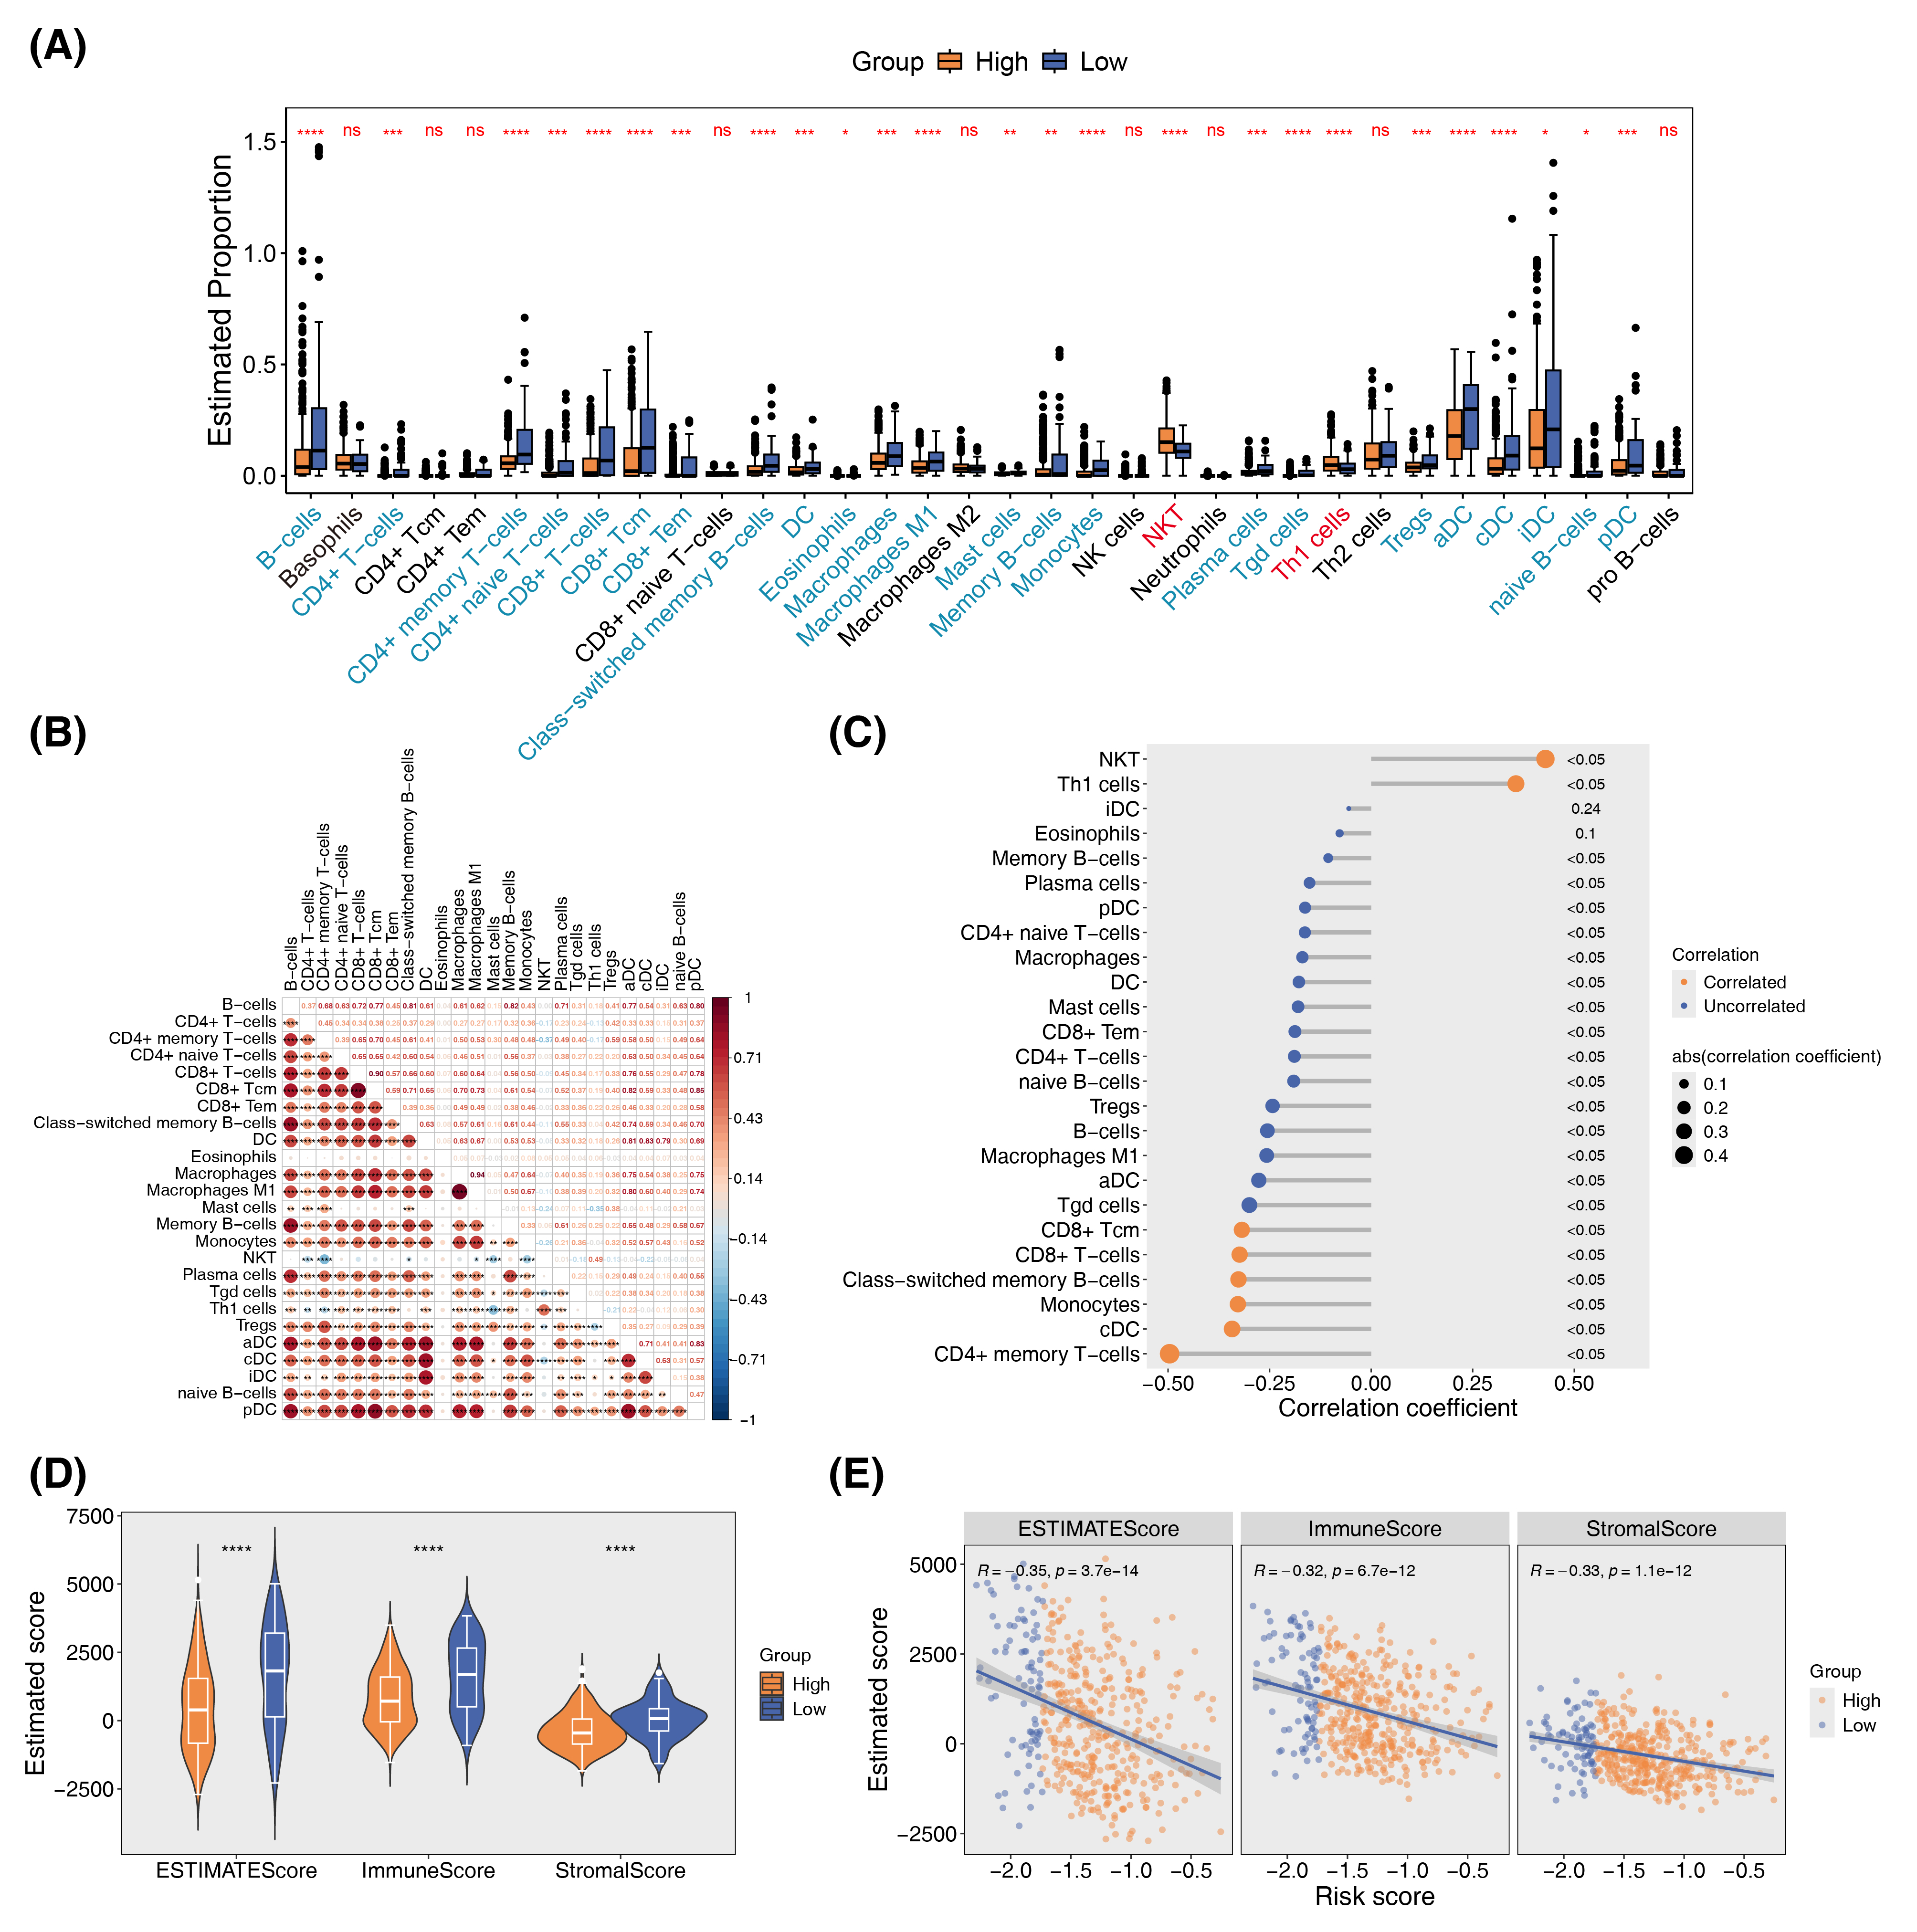
To investigate immune cell infiltration in SKCM, we calculated infiltration scores for 34 immune cell types in the TCGA-SKCM cohort using the xCell algorithm. Significant differences were observed in 25 cell types between high-risk and low-risk groups, with 23 showing lower infiltration scores in the high-risk group and 2 showing higher scores (Figure 4A). Spearman correlation analysis revealed predominantly positive correlations among immune cell infiltration scores (Figure 4B), while differential immune cell scores were negatively correlated with risk scores (Figure 4C). Using the ESTIMATE algorithm, we assessed immune cell, stromal cell, and combined scores, finding all three significantly lower in the high-risk group (Figure 4D). These scores also exhibited negative correlations with risk scores (Figure 4E).
Figure 4 Relationships between CA-related signature genes and immune infiltration. (A) Estimation of the immune infiltration levels utilizing the Xcell algorithm across different risk score groups in TCGA-SKCM. (B) Correlation heatmaps of differential immune cells. (C) Correlation analysis between differential immune cells and risk score. (D) The differences in TME score. (E) Correlation analysis between TME score and risk score.
Analysis of immune response capacity and immune status
We first analyzed the Immune Prognostic Score (IPS) in the TCGA-SKCM cohort. The results indicated that there was no significant difference in scores between the high-risk and low-risk groups when both CTLA4 and PD1 were suppressed. However, when either one of the immune checkpoints was suppressed or neither was suppressed, the low-risk group exhibited higher response scores (Supplementary Figure 5A). To further clarify the differences in immune checkpoint expression levels, we analyzed the transcriptional expression of 42 immune checkpoints between the high-risk and low-risk groups in the TCGA-SKCM cohort. The findings revealed that 40 immune checkpoints were expressed at lower levels in the high-risk group (Supplementary Figure 5B).
Drug sensitivity analysis
To assess the sensitivity of SKCM patients to commonly used chemotherapeutic agents, we predicted the IC50 values of 198 chemotherapeutic drugs within the TCGA-SKCM cohort and compared the differences between high-risk and low-risk groups. Among the top ten drugs presented, the high-risk group exhibited higher IC50 values (Supplementary Figure 6).
Somatic mutation analysis
We analyzed the mutation status of the top 20 genes in the TCGA-SKCM cohort. The results indicated that 94.86% of patients in the high-risk group (351 individuals) had somatic mutations, while 96.34% of patients in the low-risk group (79 individuals) exhibited somatic mutations. The most common type of mutation in both groups was multi-site mutations, followed by missense mutations. The gene with the highest mutation frequency was TTN, followed by MUC16. Notably, mutations in DNAH5 ranked third in the high-risk group but ranked tenth in the low-risk group (Supplementary Figure 7).
Analysis of prognostic genes regulatory mechanisms
We first utilized the miRNet database to predict the transcription factors targeting the prognostic genes and constructed a transcription factor-prognostic gene interaction network. CDK2 was targeted by 14 transcription factors. The transcription factor FOXC1 was found to target three prognostic genes (Supplementary Figure 8A). Subsequently, we employed the geneMANIA database to investigate the interactions of prognostic genes with other genes. The analysis revealed 20 interacting genes, with NUBP2 demonstrating the strongest interaction (Supplementary Figure 8B).
Single-cell transcriptome sequencing analysis
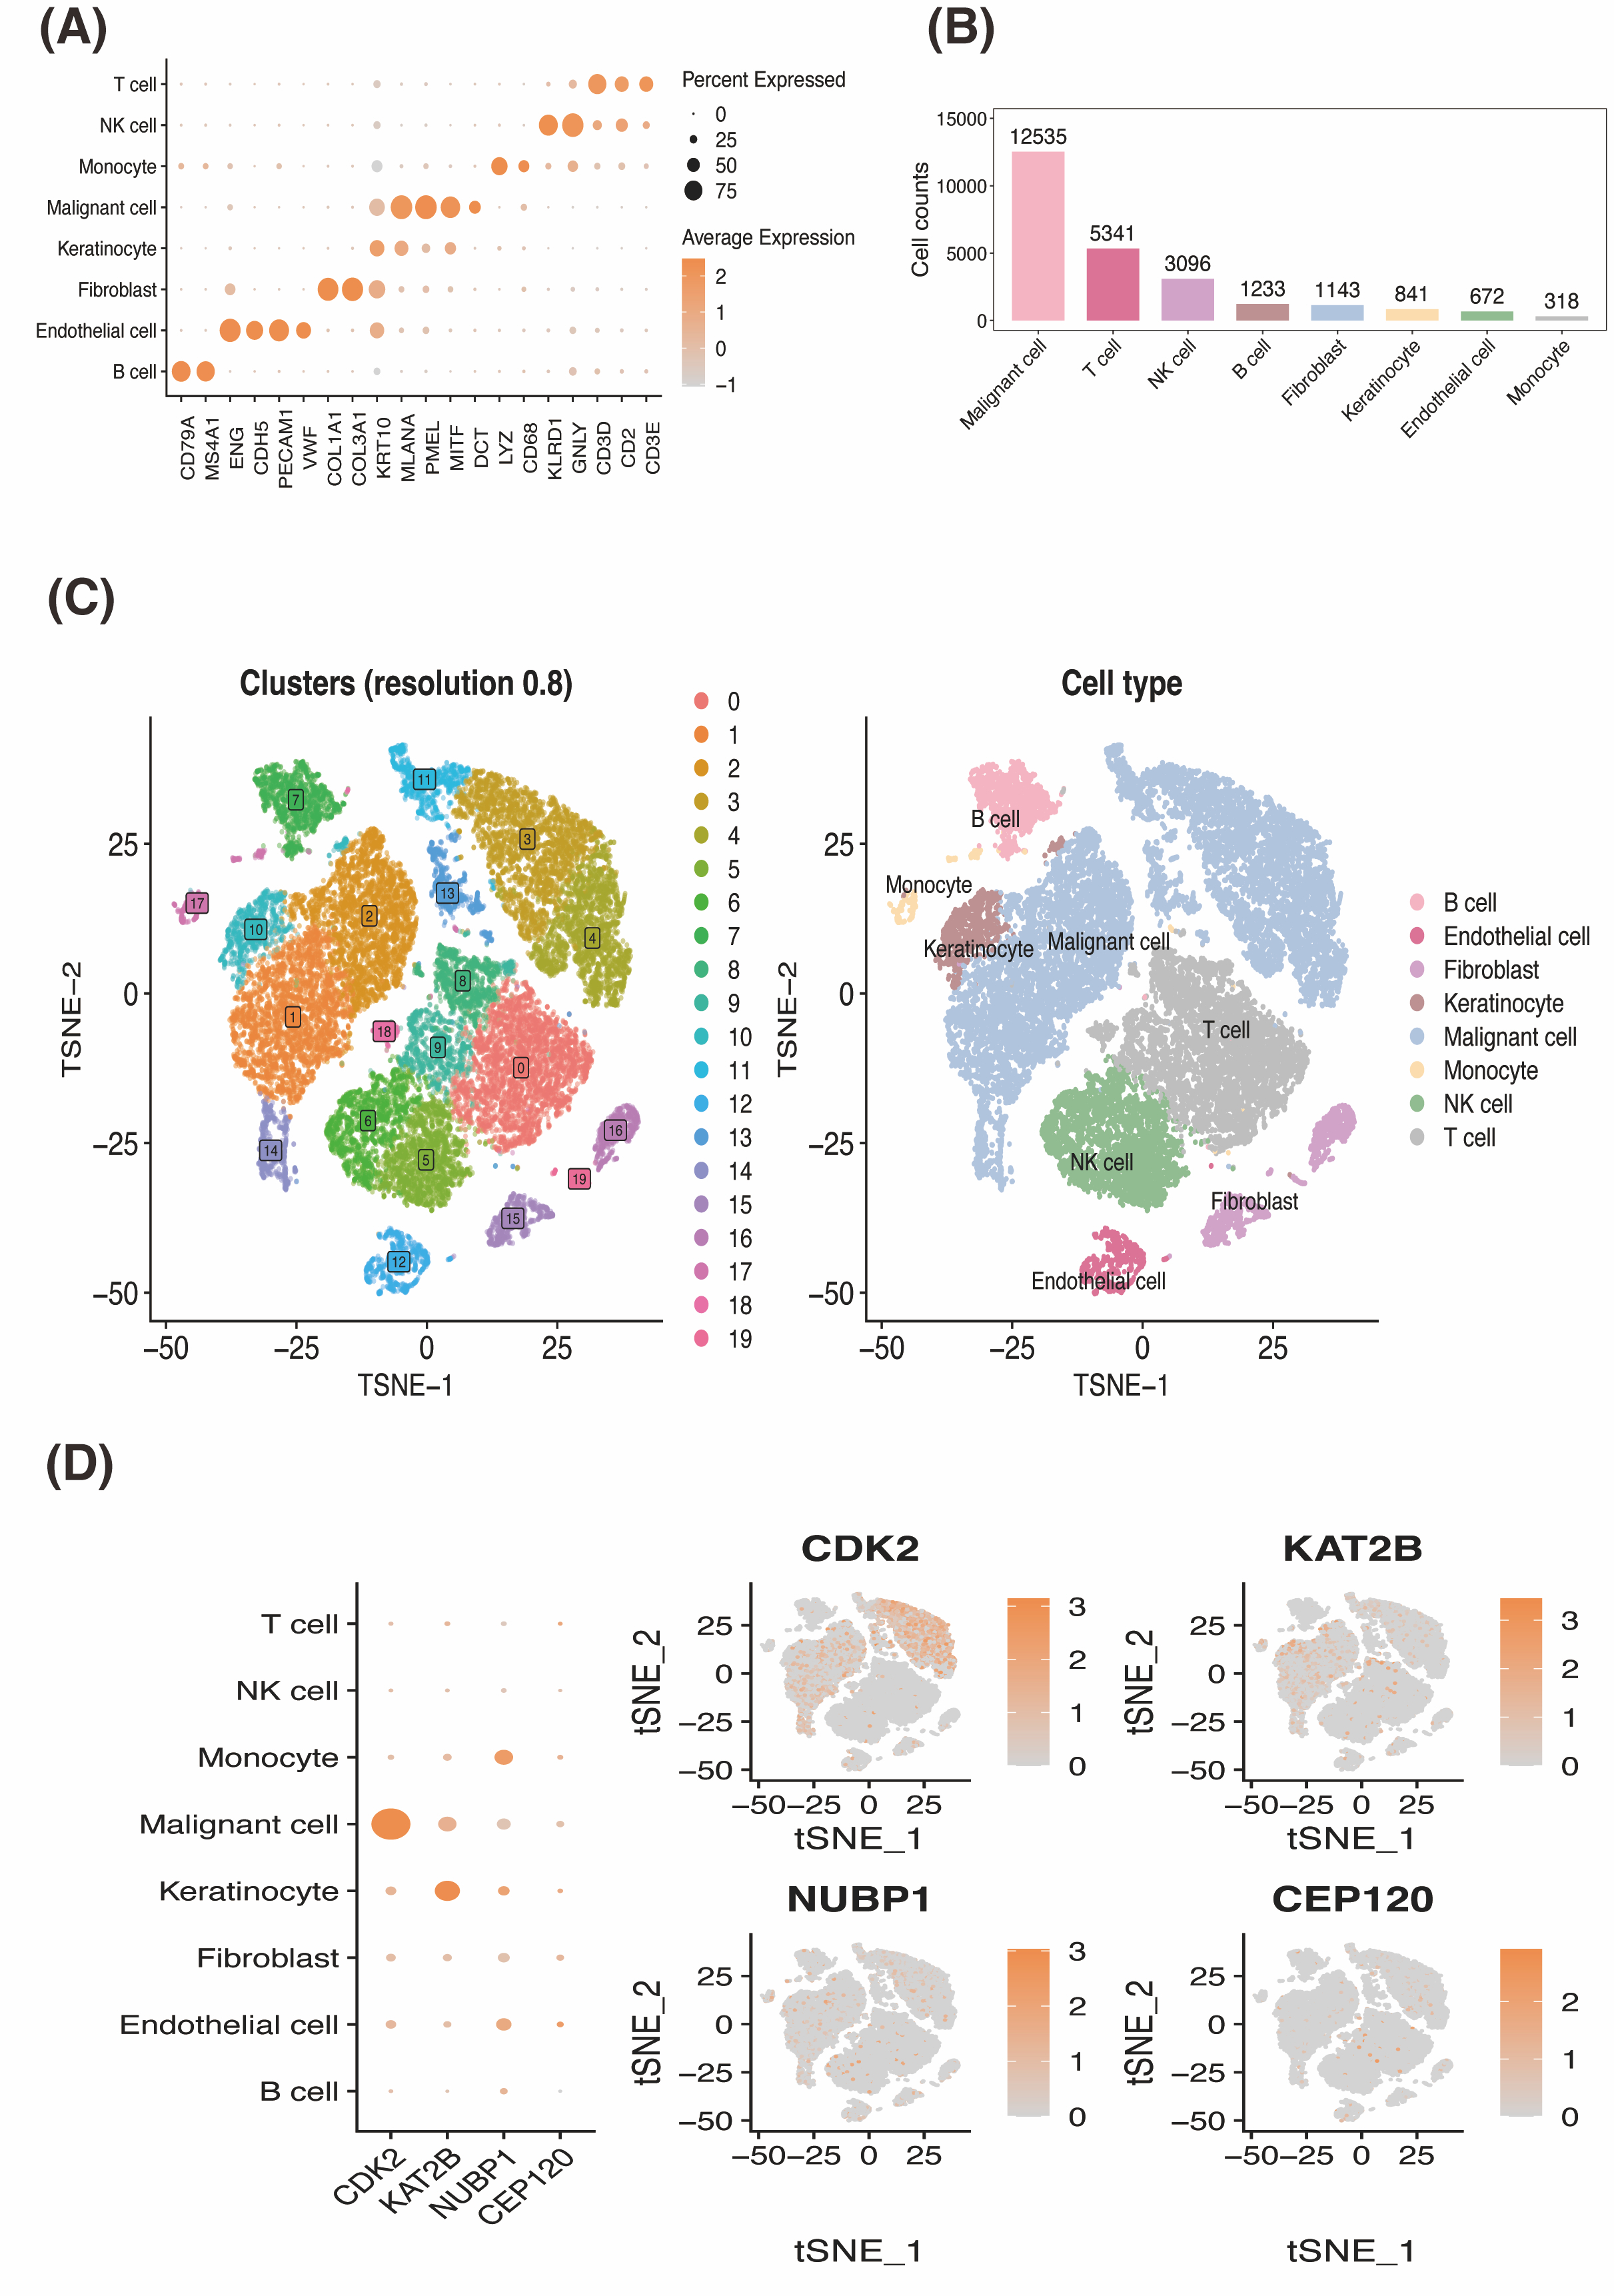
We utilized the single-cell dataset GSE215120 to explore SKCM pathogenesis. Supplementary Figure 9A displays the number of genes, counts, and mitochondrial proportions quality control, while Supplementary Figure 9B presents a volcano plot of the variable genes. Based on the JackStraw plot and elbow plot (Supplementary Figure 9C), we selected 15 clusters for analysis. Dimensionality reduction and clustering yielded 20 cell clusters, annotated into eight cell types: B cells, endothelial cells, fibroblasts, keratinocytes, malignant cells, monocytes, NK cells, and T cells (Figure 5A). Figure 5B illustrates marker gene expression for each cell type. Statistical analysis revealed malignant cells, T cells, and NK cells as the top three cell types (Figure 5C). Prognostic gene expression analysis identified malignant cells, keratinocytes, and monocytes as key players for pseudotime analysis (Figure 5D).
Figure 5 Analysis of the SKCM by single-cell RNA sequencing. (A) The T-distributed stochastic neighbor embedding (tSNE) algorithm was applied for dimensionality reduction analysis, and eight cell clusters were successfully classified. (B) Dot plot of marker genes expression in different SKCM cell subsets. (C) Cell proportions of cell subsets in SKCM samples. (D) Dot plot and feature plots of the expression distribution for prognostic genes in cell subsets.
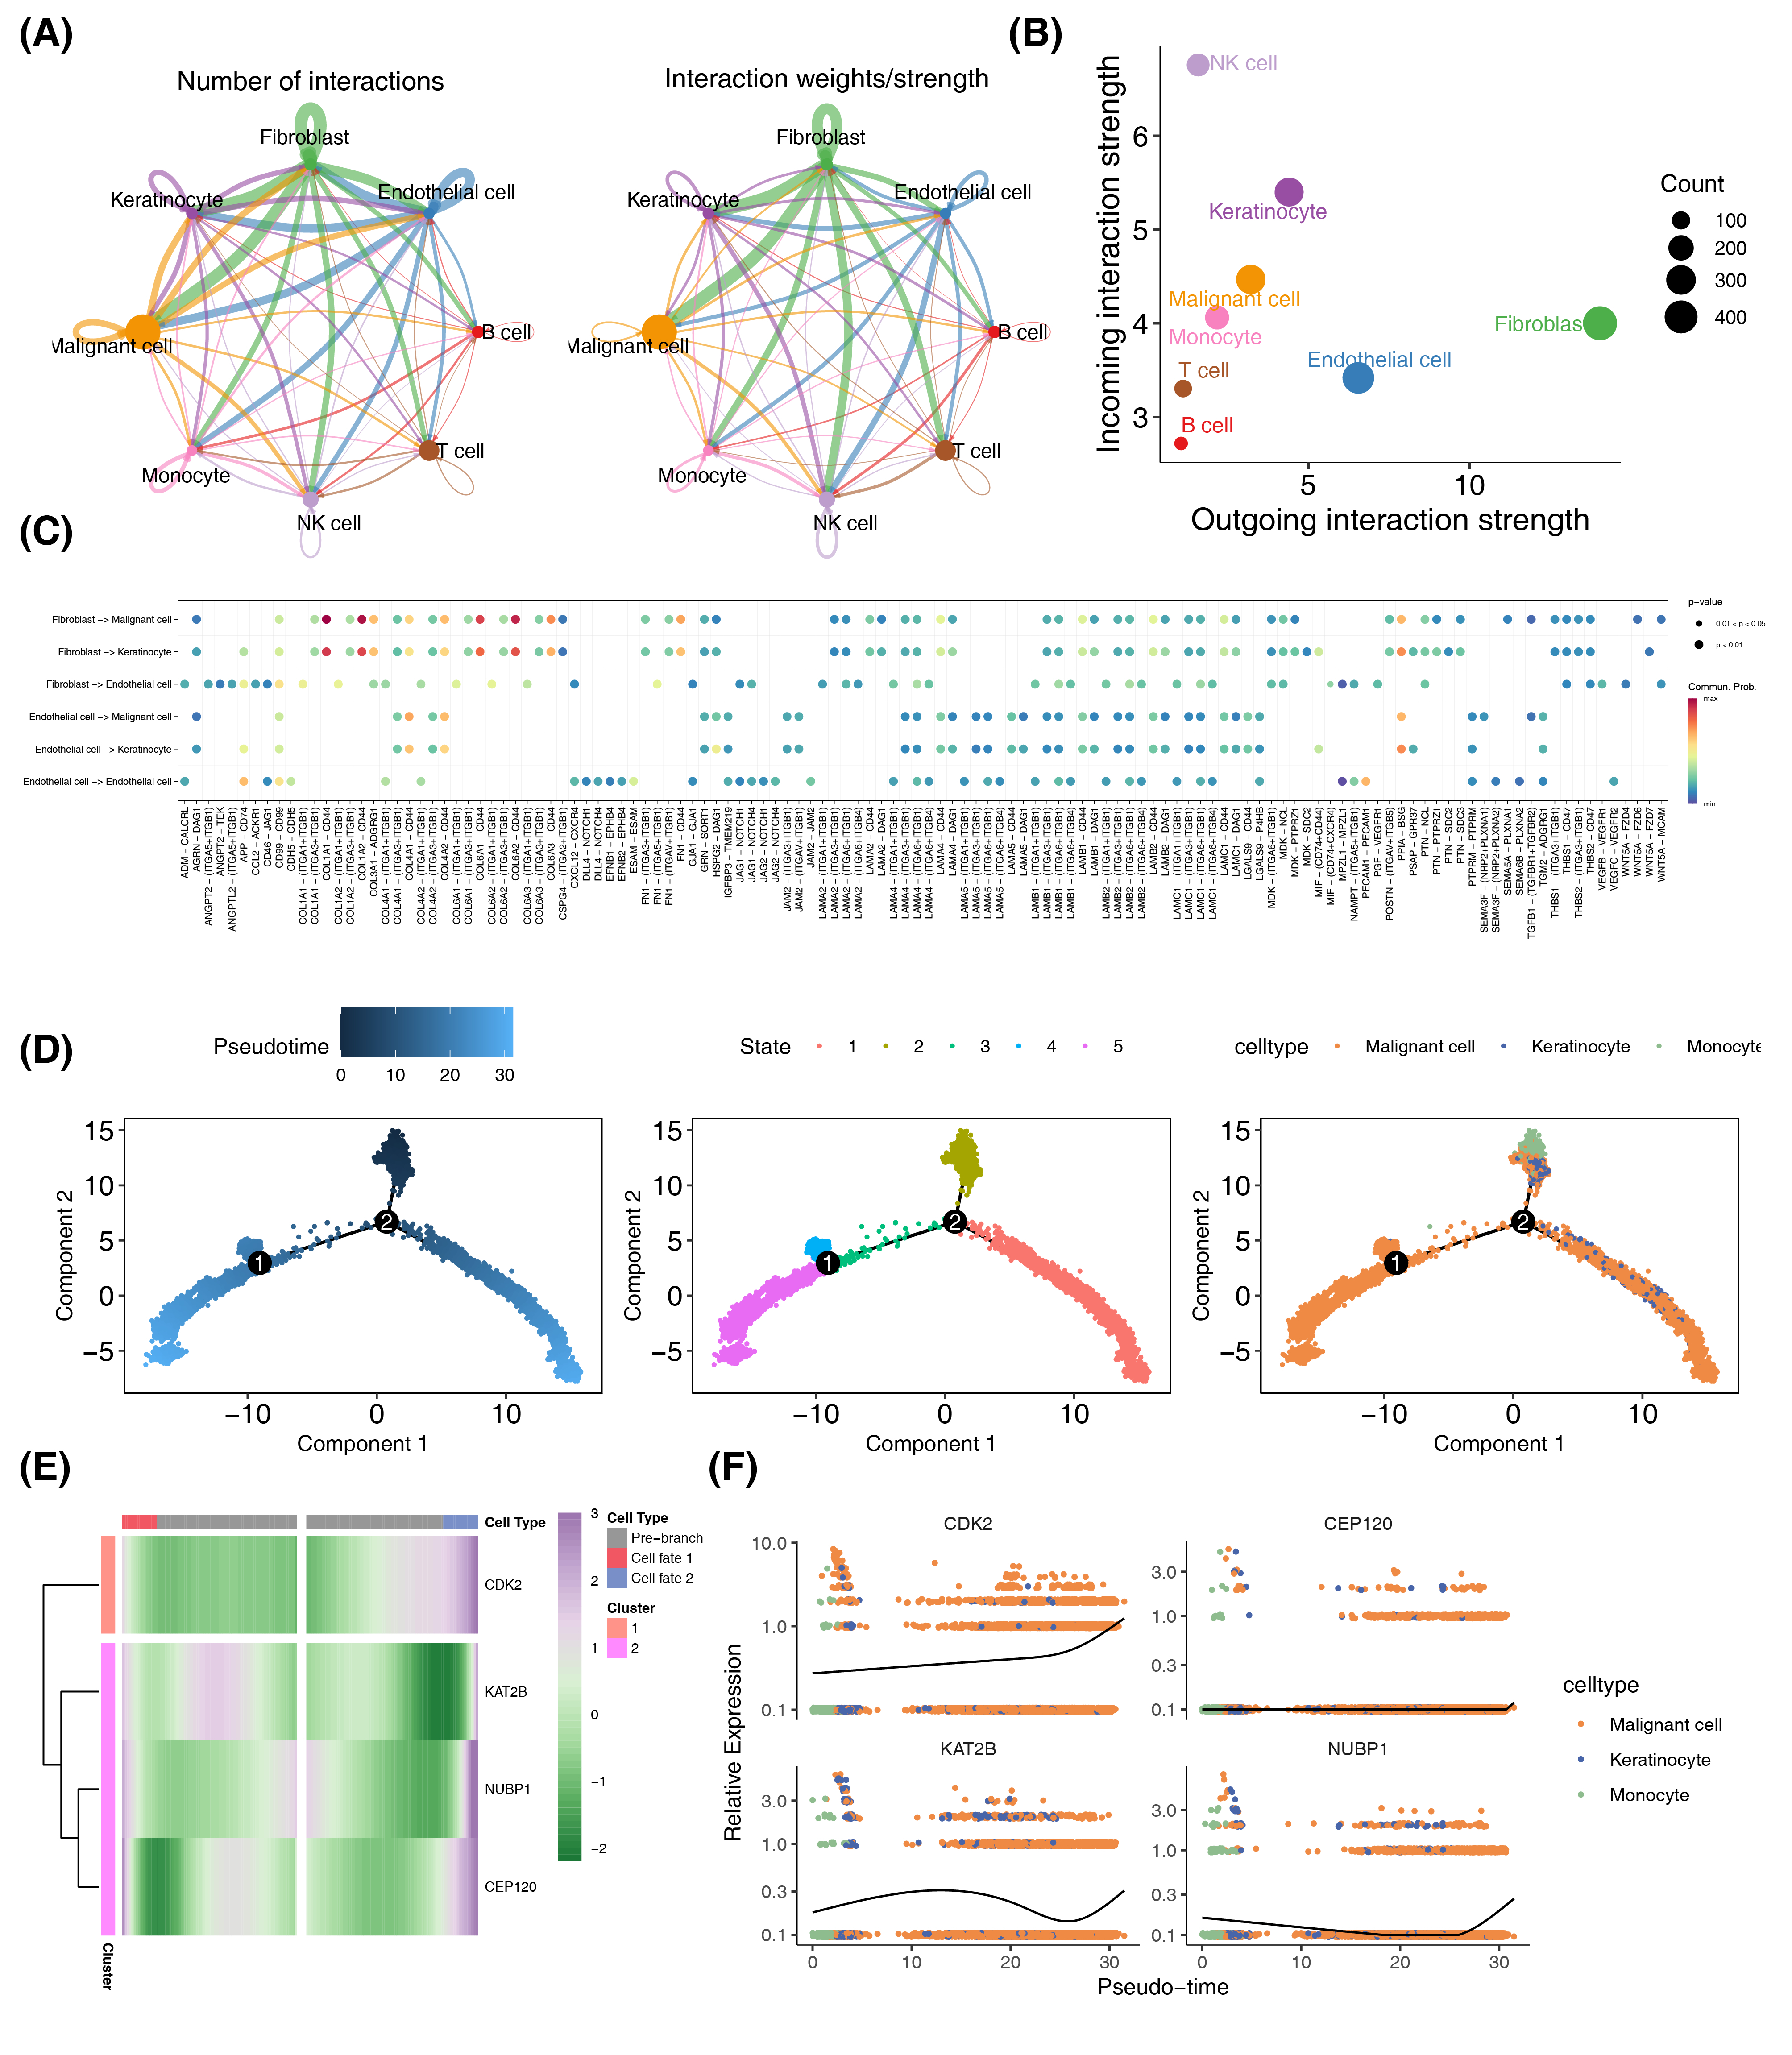
To investigate receptor-ligand interactions among the eight annotated cell types, we inferred intercellular communication. The network diagram illustrates the quantity and strength of communication networks (Figure 6A). Endothelial cells, fibroblasts, keratinocytes, NK cells, and malignant cells exhibited higher numbers of links, while B cells, T cells, and monocytes had fewer (Figure 6B). We categorized endothelial cells and fibroblasts as signal senders and malignant cells, keratinocytes, and NK cells as signal receivers. The bubble plot (Figure 6C) revealed that communication between these groups primarily involved genes such as COL1A1, COL1A2, COL4A1, COL4A2, COL6A1, COL6A2, and COL6A3, among others.
We performed pseudotime analysis based on cell expression pattern similarities, identifying a major path with two minor branches. This assigned pseudotime-dependent progression states to malignant cells, keratinocytes, and monocytes using Monocle2-reconstructed trajectories (Figure 6D). Prognostic gene expression patterns along the melanoma progression trajectory were analyzed, revealing two distinct clusters in the pseudotime heatmap (Figure 6E). The pseudo-time plot reveal that the expression levels of the prognostic genes CEP120 and NUBP1 remain relatively stable throughout the cell development process, with NUBP1 increasing only at the end. In contrast, CDK2 expression gradually rises during the coexistence of malignant cells, monocytes, and keratinocytes, accelerating when only malignant cells are present. KAT2B shows a slow increase in expression during the phase of coexistence among the three cell types, followed by a decline after monocytes completely transition. However, KAT2B expression rises sharply when only malignant cells remain. In summary, during the progression of melanoma, the changes in expression levels of CDK2 and KAT2B primarily regulate the transition of monocytes and keratinocytes into malignant cells. (Figure 6F).
Figure 6 Crosstalk between cell subtypes and Pseudo-Time analysis. (A) An overview of cell-cell interactions. Arrow and edge color indicate direction. Edge thickness indicates the number (Left) or the weighted (Right) of interaction between populations. The loops indicate autocrine circuits. (B) Scatter plot showing the interaction strengths of different cell types, and the size of the bubbles is proportional to the number of inferred links associated with each cell subtype. (C) The dot plot of communication probability and significance of different cellular interactions, where each row represents a specific type of cellular interaction, each column represents a different gene-interaction pair, and the size of the bubbles indicates the probability of communication, with larger bubbles increasing the probability, and the color indicates the significance level. (D) Distribution of three cell subtypes on the pseudo-time trajectory. Cells are colored based on pseudo-time, state and cell type. (E) Heatmap shows the expression of prognostic genes along the pseudo-time in each cell cluster. (F) Expression kinetics of four genes in three cell subtypes along the pseudo-time. Scatter plot shows the variability of gene expressions following pseudo-time based on cell states.
Analysis of prognostic genes expression
We found that all four prognostic genes were upregulated in tumor tissues in the GSE15605 dataset (Supplementary Figure 10A). Subsequently, we utilized the Human Protein Atlas (HPA) database to download immunofluorescence images of prognostic genes in normal skin melanocytes and melanoma tissues. The results showed that CDK2 and NUBP1 exhibited high expression at the protein level in SKCM, while CEP120 did not display detectable fluorescence signals. KAT2B displayed high fluorescence signal; however, it was apparent that its expression was more intense in tumor tissues. In summary, the expression patterns of CDK2 and NUBP1 are consistent at both transcriptomic and protein levels (Supplementary Figure 10B).
Discussion
CA has been shown to be involved in the development and progression of human cancers and is also a valuable prognostic factor in various cancer types[7] . However, there are relatively few studies on centrosome amplification in SKCM. Therefore, we aimed to evaluate the effect of CA-RGs on cancer development, prognosis prediction, tumor immune microenvironment changes and treatment response in SKCM.
We identified 17 genes by intersecting normal-tumor differential genes from the GSE15605 database with 76 centrosome amplification-related genes (CA-RGs) from the Gene Ontology database, which were enriched in centrosomal functions and pathways. To refine CA-RGs in melanoma and investigate their association with prognosis in SKCM, we constructed a molecular signature based on 4 prognostic genes using Cox regression analysis. A CA-RGs risk score was calculated for each SKCM patient, and patients were stratified into high- and low-risk subgroups based on an optimal cutoff. The high-risk group showed a significantly worse overall survival (OS), consistent across stratified survival analyses in GEO cohorts. Risk scores were significantly associated with clinical T stages, with higher scores correlating with poorer survival in the T3/T4 stages. Univariate and multivariate Cox analyses confirmed the CA-related signature as an independent prognostic factor. To enhance its predictive performance and clinical applicability, a nomogram integrating the CA-related signature and two additional prognostic factors was developed. Calibration curves, multi-index ROC curves, and decision curve analysis (DCA) demonstrated its superior efficacy in predicting OS compared to traditional clinical features such as age and histological stage.
The most significant finding from this study is the identification of CDK2 as a key prognostic factor. Cyclin-dependent kinase 2 (CDK2) plays a critical role in the cell cycle by regulating the transition from the G1 phase to the S phase[36] , and is required for centrosome duplication[37] . Matsuura found that the phosphorylation of SMAD3 by CDK2–cyclin-E limits its transcriptional activity and eventually slows cell-cycle progression[38] . Our gene set enrichment analysis (GSEA) revealed that CDK2 is involved in oxidative phosphorylation and immune-related pathways as well, indicating its dual role in metabolic regulation and immune evasion[39] during melanoma progression. Lysine acetyltransferase 2B (KAT2B) ,also named as PCAF, plays a crucial role in the regulation of gene expression at the post-transcriptional level by acetylation[40] , and is associated with many types of cancer. It has been reported to be involved in regulating the acetylation and stability of HMGA2 to accelerate the growth of esophageal squamous cell carcinoma[41] . Moreover, induction of PGK1 enzymatic activity and cancer cell metabolism by KAT2B engagement-mediated acetylation plays an important role in liver cancer progression[42] . On the other side, one outcome demonstrated that PCAF blocked the growth of hepatocellular carcinoma via enhancing cell autophagy[43] . Li has found KAT2B degradation contributes to the development of pancreatic cancer via the Ras-ERK1/2 signaling pathway[44] . Our results show that KAT2B is a protective prognostic gene analyzed by Cox regression analysis and is engaged in autophagy, which is consistent with a previous study. In our analysis of the prognostic gene interaction network, we found that NUBP1 and NUBP2 exhibit the closest interaction. This is likely because both proteins are crucial for the synthesis and transport of intracellular iron-sulfur clusters, and they function in a coordinated manner to fulfill their roles in these processes[45] . NUBP1, NUBP2 and KIFC5A have been implicated in the regulation of centriole duplication with their depletion causing supernumerary centrioles[46] . This function is critical in maintaining genomic stability, as excessive CA is known to promote tumorigenesis by driving chromosomal instability[47] . The protective nature of NUBP1 identified in our study suggests that restoring its function could be a potential therapeutic strategy to counteract CA-induced tumor progression in SKCM. CEP120, although not significantly associated with survival, was included in our final risk model based on its role in centrosome biogenesis and cilia formation[48] . While its exact function in melanoma remains less clear, it has been implicated in centriole elongation and centrosomal microtubule organization[49] , both of which are essential for proper cell division . Further research is warranted to elucidate whether CEP120 plays a contributory role in SKCM progression through its involvement in CA or other mechanisms of tumor growth. Our results of GSVA analysis indicate that melanoma development is associated with multiple signaling pathways. For instance, the MYC_TARGETS_V1 and MYC_TARGETS_V2 pathways are linked to MYC, a transcription factor that regulates cell proliferation, growth, and metabolism, often overexpressed to promote tumor cell proliferation and survival[50] . Additionally, the INTERFERON_GAMMA_RESPONSE pathway involves interferon-gamma (IFN-γ), a crucial immune regulator that plays a key role in modulating immune responses, particularly in antiviral and antitumor reactions[51] . The downregulation of the IFN-γ-related pathway in melanoma indicates a reduced antitumor capacity, facilitating tumor progression.
Beyond the effects on tumor growth, CA-RGs also affect the composition of the tumor immune microenvironment. Tumor-associated macrophages (TAM) can be divided into two major subtypes: M1 TAMs counteract tumor progression while M2 TAMs promote tumor growth and inhibit tumor immunity[52] . In this study, we found that M1 macrophages infiltrated the low CA-related signature risk group more than the high CA-related signature risk group. The proliferation and cytotoxicity CD8+ T cells and their secretion of IFN-γ induce an antitumor response[53] . Tumor regression after ICB requires abundant infiltration of CD8+ T cells in proximity to tumor cells[54] . Consistent with this, our results show that the low-risk group harbors more CD8+ cytotoxic T lymphocytes. This suggests that the tumor microenvironment in the low-risk group may have stronger antitumor immune activity, while the high-risk group tends toward an immunosuppressive state. ESTIMATE analysis indicates that the low-risk group has significantly higher ESTIMATE, immune, and stromal scores compared to the high-risk group. This finding suggests that the low-risk group’s microenvironment is richer in immune and stromal components, potentially enhancing antitumor immune responses and contributing to better prognosis. Furthermore, the correlation analysis shows a negative correlation between the risk score and the ESTIMATE, immune, and stromal scores, indicating that as the risk score increases, immune and stromal component levels in the tumor microenvironment decrease, which indicates that a higher risk score may be associated with a microenvironment deficient in immune activity and stromal support, reflective of a more aggressive and immune-evasive tumor profile. To date, immunotherapeutic strategies have manifested curative therapeutic effects in unresectable or metastatic melanoma[55] . Unfortunately, the clinical benefits remain unsatisfactory owing to low objective remission rates and resistance to ICB in a substantial fraction of melanoma patients. Investigating a predictive marker for benefit from immunotherapy is thus urgently needed. Cytotoxic T-lymphocyte associated protein-4 (CTLA-4) and the Programmed Death Receptor 1 (PD-1) are immune checkpoint molecules that are well-established targets of antibody immunotherapies for the management of malignant melanoma[4] . In our study, across all checkpoint expression statuses, low-risk scores consistently associate with higher IPS scores in samples where at least one immune checkpoint is expressed. This indicates that high-risk score group may enhance immune evasion, while low-risk score group exhibit greater immune activity and higher potential responsiveness to immunotherapy. These findings support a stratified approach to immunotherapy, where patients with low-risk score may be more suitable candidates for PD1- or CTLA4-based checkpoint inhibition. We also evaluated the sensitivity of high-risk and low-risk patients to chemotherapeutics and targeted drugs to better guide clinical medication for SKCM patients and the high-risk group exhibited higher IC50 values, indicating that patients in the low-risk group have greater sensitivity to chemotherapy.
At the single-cell level, malignant cells, monocytes, and keratinocytes emerge as key cell types in melanoma progression. This process relies primarily on communication from fibroblasts to keratinocytes and malignant cells. Under the regulatory influence of prognostic genes CDK2 and KAT2B, this signaling promotes the transition of keratinocytes and monocytes toward malignant cell phenotypes.
Conclusion
Although our study has significant clinical implications for survival prediction and therapeutic decision-making, several limitations must be acknowledged. First, we identified four novel prognostic genes related to centrosome amplification and constructed high-performance risk and prognostic models. These models offer new, reliable tools for clinical survival prediction and patient risk assessment and provide potential therapeutic targets for melanoma, including drug and immunotherapy interventions. Furthermore, our findings reveal melanoma progression mechanisms and their relationships with prognostic genes at a higher-resolution level. However, given that this study is based on data analysis, there are inherent limitations. The molecular mechanisms through which these CA-related signature biomarkers contribute to disease progression and therapy resistance in patients with SKCM should be further investigated through in experimental studies.
Abbreviations
CA: Centrosome Amplification; CA-RGs: Centrosome Amplification-Related Genes; PCM: Pericentriolar Material; DEGs: Differentially Expressed Genes; GO: Gene Ontology; KEGG: Kyoto Encyclopedia of Genes and Genomes; PPI: Protein-Protein Interaction; TCGA: The Cancer Genome Atlas; ROC: Receiver Operating Characteristic; AUC: the Area Under the Curve; GSVA: Gene Set Variation Analysis; IPS: Immune Phenotype Scores; TME: Tumor Microenvironment; HPA: Human Protein Atlas
Supplementary Material
Supplementary methods, results, spectra, figures.
Acknowledgements
All authors would like to thank the TCGA, GEO datasets, which provided data for this study.
Author contributions
Wendong Chen contributed to the conceptualization, data curation ,methodology and software, Dawei Wang contributed to the formal analysis and investigation, Zhenyu Wu contributed to the validation and visualization, Shengrong Cheng contributed to supervision, Fei Zhu contributed to project administration and resources. Wendong Chen, Dawei Wang, Zhenyu Wu and Shengrong Cheng contributed to writing the original draft. Hailin Yao and Fei Zhu contributed to reviewing and editing.
Funding information
Not applicable.
Ethics approval and consent to participate
Not applicable.
Competing Interests
The authors declare that they have no existing or potential commercial or financial relationships that could create a conflict of interest at the time of conducting this study.
Data Availability
All data needed to evaluate the conclusions in the paper are present in the paper or the Supplementary Materials. Additional data related to this paper may be requested from the authors.
References
[1]Xu Y, Lou L, Wang Y, Miao Q, Jin K, Chen M, et al. Epidemiological Study of Uveal Melanoma from US Surveillance, Epidemiology, and End Results Program (2010–2015). Journal of Ophthalmology 2020;2020:1–8. https://doi.org/10.1155/2020/3614039.
[2]Siegel RL, Miller KD, Wagle NS, Jemal A. Cancer statistics, 2023. CA A Cancer J Clinicians 2023;73:17–48. https://doi.org/10.3322/caac.21763.
[3]Shain AH, Bastian BC. From melanocytes to melanomas. Nat Rev Cancer 2016;16:345–58. https://doi.org/10.1038/nrc.2016.37.
[4]Willsmore ZN, Coumbe BGT, Crescioli S, Reci S, Gupta A, Harris RJ, et al. Combined anti‐PD‐1 and anti‐CTLA‐4 checkpoint blockade: Treatment of melanoma and immune mechanisms of action. Eur J Immunol 2021;51:544–56. https://doi.org/10.1002/eji.202048747.
[5]Vinogradova T, Paul R, Grimaldi AD, Loncarek J, Miller PM, Yampolsky D, et al. Concerted effort of centrosomal and Golgi-derived microtubules is required for proper Golgi complex assembly but not for maintenance. MBoC 2012;23:820–33. https://doi.org/10.1091/mbc.E11-06-0550.
[6]Zhao JZ, Ye Q, Wang L, Lee SC. Centrosome amplification in cancer and cancer-associated human diseases. Biochimica et Biophysica Acta (BBA) - Reviews on Cancer 2021;1876:188566. https://doi.org/10.1016/j.bbcan.2021.188566.
[7]Mittal K, Kaur J, Sharma S, Sharma N, Wei G, Choudhary I, et al. Hypoxia Drives Centrosome Amplification in Cancer Cells via HIF1α-dependent Induction of Polo-Like Kinase 4. Mol Cancer Res 2022;20:596–606. https://doi.org/10.1158/1541-7786.MCR-20-0798.
[8]Denu RA, Shabbir M, Nihal M, Singh CK, Longley BJ, Burkard ME, et al. Centriole Overduplication is the Predominant Mechanism Leading to Centrosome Amplification in Melanoma. Mol Cancer Res 2018;16:517–27. https://doi.org/10.1158/1541-7786.MCR-17-0197.
[9]Ritchie ME, Phipson B, Wu D, Hu Y, Law CW, Shi W, et al. limma powers differential expression analyses for RNA-sequencing and microarray studies. Nucleic Acids Res 2015;43:e47–e47. https://doi.org/10.1093/nar/gkv007.
[10]Villanueva RAM, Chen ZJ. ggplot2: Elegant Graphics for Data Analysis (2nd ed.). Measurement: Interdisciplinary Research and Perspectives 2019;17:160–7. https://doi.org/10.1080/15366367.2019.1565254.
[11]Kolde R. pheatmap: Pretty Heatmaps 2019.
[12]Yan [aut L, cre. ggvenn: Draw Venn Diagram by “ggplot2” 2023.
[13]Yu G, Wang L-G, Han Y, He Q-Y. clusterProfiler: an R Package for Comparing Biological Themes Among Gene Clusters. OMICS: A Journal of Integrative Biology 2012;16:284–7. https://doi.org/10.1089/omi.2011.0118.
[14]Walter W, Sánchez-Cabo F, Ricote M. GOplot: an R package for visually combining expression data with functional analysis. Bioinformatics 2015;31:2912–4. https://doi.org/10.1093/bioinformatics/btv300.
[15]Shannon P, Markiel A, Ozier O, Baliga NS, Wang JT, Ramage D, et al. Cytoscape: A Software Environment for Integrated Models of Biomolecular Interaction Networks. Genome Res 2003;13:2498–504. https://doi.org/10.1101/gr.1239303.
[16]Therneau TM, until 2009) TL (original S->R port and R maintainer, Elizabeth A, Cynthia C. survival: Survival Analysis 2024.
[17]Friedman J, Hastie T, Tibshirani R. Regularization Paths for Generalized Linear Models via Coordinate Descent. J Stat Softw 2010;33:1–22.
[18]Gordon M, Lumley T. forestplot: Advanced Forest Plot Using “grid” Graphics 2023.
[19]Pawar A, Chowdhury OR, Salvi O. A narrative review of survival analysis in oncology using R. Cancer Research, Statistics, and Treatment 2022;5:554–61. https://doi.org/10.4103/crst.crst_230_22.
[20]Li L, Greene T, Hu B. A simple method to estimate the time-dependent receiver operating characteristic curve and the area under the curve with right censored data. Stat Methods Med Res 2018;27:2264–78. https://doi.org/10.1177/0962280216680239.
[21]Lu X, Wang Y, Jiang L, Gao J, Zhu Y, Hu W, et al. A Pre-operative Nomogram for Prediction of Lymph Node Metastasis in Bladder Urothelial Carcinoma. Front Oncol 2019;9. https://doi.org/10.3389/fonc.2019.00488.
[22]Jr FEH. rms: Regression Modeling Strategies 2024.
[23]Blanche P, Dartigues J, Jacqmin‐Gadda H. Estimating and comparing time‐dependent areas under receiver operating characteristic curves for censored event times with competing risks. Statistics in Medicine 2013;32:5381–97. https://doi.org/10.1002/sim.5958.
[24]Li R, Chen Y, Yang B, Li Z, Wang S, He J, et al. Integrated bioinformatics analysis and experimental validation identified CDCA families as prognostic biomarkers and sensitive indicators for rapamycin treatment of glioma. PLoS ONE 2024;19:e0295346. https://doi.org/10.1371/journal.pone.0295346.
[25]Hänzelmann S, Castelo R, Guinney J. GSVA: gene set variation analysis for microarray and RNA-Seq data. BMC Bioinformatics 2013;14:7. https://doi.org/10.1186/1471-2105-14-7.
[26]Aran D, Hu Z, Butte AJ. xCell: digitally portraying the tissue cellular heterogeneity landscape. Genome Biol 2017;18:220. https://doi.org/10.1186/s13059-017-1349-1.
[27]Kassambara A. ggpubr: “ggplot2” Based Publication Ready Plots 2023.
[28]Wei T, Simko V, Levy M, Xie Y, Jin Y, Zemla J, et al. corrplot: Visualization of a Correlation Matrix 2024.
[29]Yoshihara K, Shahmoradgoli M, Martínez E, Vegesna R, Kim H, Torres-Garcia W, et al. Inferring tumour purity and stromal and immune cell admixture from expression data. Nat Commun 2013;4:2612. https://doi.org/10.1038/ncomms3612.
[30]Geeleher P, Cox N, Huang RS. pRRophetic: An R Package for Prediction of Clinical Chemotherapeutic Response from Tumor Gene Expression Levels. PLoS ONE 2014;9:e107468. https://doi.org/10.1371/journal.pone.0107468.
[31]Zhang G, Wang Y, Chen B, Guo L, Cao L, Ren C, et al. Characterization of frequently mutated cancer genes in Chinese breast tumors: a comparison of Chinese and TCGA cohorts. Ann Transl Med 2019;7:179–179. https://doi.org/10.21037/atm.2019.04.23.
[32]Mayakonda A, Lin D-C, Assenov Y, Plass C, Koeffler HP. Maftools: efficient and comprehensive analysis of somatic variants in cancer. Genome Res 2018;28:1747–56. https://doi.org/10.1101/gr.239244.118.
[33]Hao Y, Hao S, Andersen-Nissen E, Mauck WM, Zheng S, Butler A, et al. Integrated analysis of multimodal single-cell data. Cell 2021;184:3573-3587.e29. https://doi.org/10.1016/j.cell.2021.04.048.
[34]Jin S, Guerrero-Juarez CF, Zhang L, Chang I, Ramos R, Kuan C-H, et al. Inference and analysis of cell-cell communication using CellChat. Nat Commun 2021;12:1088. https://doi.org/10.1038/s41467-021-21246-9.
[35]Trapnell C, Cacchiarelli D, Grimsby J, Pokharel P, Li S, Morse M, et al. The dynamics and regulators of cell fate decisions are revealed by pseudotemporal ordering of single cells. Nat Biotechnol 2014;32:381–6. https://doi.org/10.1038/nbt.2859.
[36]Tadesse S, Anshabo AT, Portman N, Lim E, Tilley W, Caldon CE, et al. Targeting CDK2 in cancer: challenges and opportunities for therapy. Drug Discovery Today 2020;25:406–13. https://doi.org/10.1016/j.drudis.2019.12.001.
[37]Matsumoto Y, Hayashi K, Nishida E. Cyclin-dependent kinase 2 (Cdk2) is required for centrosome duplication in mammalian cells. Current Biology 1999;9:429–32. https://doi.org/10.1016/s0960-9822(99)80191-2.
[38]Matsuura I, Denissova NG, Wang G, He D, Long J, Liu F. Cyclin-dependent kinases regulate the antiproliferative function of Smads. Nature 2004;430:226–31. https://doi.org/10.1038/nature02650.
[39]Qiu X, Li Y, Zhang Z. Crosstalk between oxidative phosphorylation and immune escape in cancer: a new concept of therapeutic targets selection. Cell Oncol 2023;46:847–65. https://doi.org/10.1007/s13402-023-00801-0.
[40]Liu X, Wang L, Zhao K, Thompson PR, Hwang Y, Marmorstein R, et al. The structural basis of protein acetylation by the p300/CBP transcriptional coactivator. Nature 2008;451:846–50. https://doi.org/10.1038/nature06546.
[41]Wu Y, Wang X, Xu F, Zhang L, Wang T, Fu X, et al. The regulation of acetylation and stability of HMGA2 via the HBXIP-activated Akt–PCAF pathway in promotion of esophageal squamous cell carcinoma growth. Nucleic Acids Res 2020;48:4858–76. https://doi.org/10.1093/nar/gkaa232.
[42]Hu H, Zhu W, Qin J, Chen M, Gong L, Li L, et al. Acetylation of PGK1 promotes liver cancer cell proliferation and tumorigenesis. Hepatology 2017;65:515–28. https://doi.org/10.1002/hep.28887.
[43]Jia Y-L, Xu M, Dou C-W, Liu Z-K, Xue Y-M, Yao B-W, et al. P300/CBP-associated factor (PCAF) inhibits the growth of hepatocellular carcinoma by promoting cell autophagy. Cell Death Dis 2016;7:e2400–e2400. https://doi.org/10.1038/cddis.2016.247.
[44]Li Y-H, Li Y-X, Li M, Song S, Ge Y, Jin J, et al. The Ras-ERK1/2 signaling pathway regulates H3K9ac through PCAF to promote the development of pancreatic cancer. Life Sciences 2020;256:117936. https://doi.org/10.1016/j.lfs.2020.117936.
[45]Fan X, Barshop WD, Vashisht AA, Pandey V, Leal S, Rayatpisheh S, et al. Iron-regulated assembly of the cytosolic iron–sulfur cluster biogenesis machinery. Journal of Biological Chemistry 2022;298:102094. https://doi.org/10.1016/j.jbc.2022.102094.
[46]Christodoulou A, Lederer CW, Surrey T, Vernos I, Santama N. Motor protein KIFC5A interacts with Nubp1 and Nubp2, and is implicated in the regulation of centrosome duplication. J Cell Sci 2006;119:2035–47. https://doi.org/10.1242/jcs.02922.
[47]Fukasawa K. Centrosome amplification, chromosome instability and cancer development. Cancer Letters 2005;230:6–19. https://doi.org/10.1016/j.canlet.2004.12.028.
[48]Tsai J-J, Hsu W-B, Liu J-H, Chang C-W, Tang TK. CEP120 interacts with C2CD3 and Talpid3 and is required for centriole appendage assembly and ciliogenesis. Sci Rep 2019;9:6037. https://doi.org/10.1038/s41598-019-42577-0.
[49]Sharma A, Gerard SF, Olieric N, Steinmetz MO. Cep120 promotes microtubule formation through a unique tubulin binding C2 domain. Journal of Structural Biology 2018;203:62–70. https://doi.org/10.1016/j.jsb.2018.01.009.
[50]Hanahan D, Weinberg RA. Hallmarks of Cancer: The Next Generation. Cell 2011;144:646–74. https://doi.org/10.1016/j.cell.2011.02.013.
[51]Jorgovanovic D, Song M, Wang L, Zhang Y. Roles of IFN-γ in tumor progression and regression: a review. Biomark Res 2020;8:49. https://doi.org/10.1186/s40364-020-00228-x.
[52]Cheng H, Wang Z, Fu L, Xu T. Macrophage Polarization in the Development and Progression of Ovarian Cancers: An Overview. Front Oncol 2019;9:421. https://doi.org/10.3389/fonc.2019.00421.
[53]St. Paul M, Ohashi PS. The Roles of CD8+ T Cell Subsets in Antitumor Immunity. Trends in Cell Biology 2020;30:695–704. https://doi.org/10.1016/j.tcb.2020.06.003.
[54]Tumeh PC, Harview CL, Yearley JH, Shintaku IP, Taylor EJM, Robert L, et al. PD-1 blockade induces responses by inhibiting adaptive immune resistance. Nature 2014;515:568–71. https://doi.org/10.1038/nature13954.
[55]Weber JS, D’Angelo SP, Minor D, Hodi FS, Gutzmer R, Neyns B, et al. Nivolumab versus chemotherapy in patients with advanced melanoma who progressed after anti-CTLA-4 treatment (CheckMate 037): a randomised, controlled, open-label, phase 3 trial. The Lancet Oncology 2015;16:375–84. https://doi.org/10.1016/S1470-2045(15)70076-8.
 Figures
 References
 Peer
Peer Information
Figure 1 Identification of prognosis-related centrosome amplification-related genes. (A) Forest plot of univariate Cox regression analysis. (B) LASSO Cox analysis for CA-RGs from univariate Cox regression. (C) Forest plot of multivariate Cox regression analysis.
Figure 2 The prognostic value of the centrosome amplification-related genes for skin cutaneous melanoma (SKCM) patients. (A, F) Kaplan–Meier curve of overall survival (OS) between high- and low-risk groups in The Cancer Genome Atlas (TCGA) cohort and Gene Expression Omnibus (GEO) cohort (GSE100797). (B, G) The predictive value of the prognostic CA-RGs measured by receiver operating characteristic (ROC) curves at 1, 3, and 5 years in the TCGA cohort and GSE100797 cohort. (C-E, H-J) The distribution of the risk score, survival status and heatmap visualizing the expression of 4 prognostic CA-RGs in the TCGA cohort and GSE100797 cohort.
Figure 3 Establishment of the clinical nomogram. (A, B) Forest plot of the univariate Cox regression analysis and multivariate Cox regression analysis containing signature-based risk score and clinical factors. (C) Nomogram for predicting 1, 3 and 5 year overall survival (OS) of skin cutaneous melanoma (SKCM) patients in The Cancer Genome Atlas (TCGA) cohort. (D) Calibration curves of the nomogram predicted the probability of the 1, 3 and 5 year OS in TCGA dataset. The x-axis shows nomogram-predicted probability of survival, and the y-axis shows actual survival. (E-G) Multi-index receiver operating characteristic (ROC) curves of the nomogram and other clinical factors for 1, 3 and 5 year risk. (H) Decision curve analysis (DCA) of the nomogram and other clinical indicators for 1, 3 and 5 year risk.
Figure 4 Relationships between CA-related signature genes and immune infiltration. (A) Estimation of the immune infiltration levels utilizing the Xcell algorithm across different risk score groups in TCGA-SKCM. (B) Correlation heatmaps of differential immune cells. (C) Correlation analysis between differential immune cells and risk score. (D) The differences in TME score. (E) Correlation analysis between TME score and risk score.
Figure 5 Analysis of the SKCM by single-cell RNA sequencing. (A) The T-distributed stochastic neighbor embedding (tSNE) algorithm was applied for dimensionality reduction analysis, and eight cell clusters were successfully classified. (B) Dot plot of marker genes expression in different SKCM cell subsets. (C) Cell proportions of cell subsets in SKCM samples. (D) Dot plot and feature plots of the expression distribution for prognostic genes in cell subsets.
Figure 6 Crosstalk between cell subtypes and Pseudo-Time analysis. (A) An overview of cell-cell interactions. Arrow and edge color indicate direction. Edge thickness indicates the number (Left) or the weighted (Right) of interaction between populations. The loops indicate autocrine circuits. (B) Scatter plot showing the interaction strengths of different cell types, and the size of the bubbles is proportional to the number of inferred links associated with each cell subtype. (C) The dot plot of communication probability and significance of different cellular interactions, where each row represents a specific type of cellular interaction, each column represents a different gene-interaction pair, and the size of the bubbles indicates the probability of communication, with larger bubbles increasing the probability, and the color indicates the significance level. (D) Distribution of three cell subtypes on the pseudo-time trajectory. Cells are colored based on pseudo-time, state and cell type. (E) Heatmap shows the expression of prognostic genes along the pseudo-time in each cell cluster. (F) Expression kinetics of four genes in three cell subtypes along the pseudo-time. Scatter plot shows the variability of gene expressions following pseudo-time based on cell states.
[1]Xu Y, Lou L, Wang Y, Miao Q, Jin K, Chen M, et al. Epidemiological Study of Uveal Melanoma from US Surveillance, Epidemiology, and End Results Program (2010–2015). Journal of Ophthalmology 2020;2020:1–8. https://doi.org/10.1155/2020/3614039.
[2]Siegel RL, Miller KD, Wagle NS, Jemal A. Cancer statistics, 2023. CA A Cancer J Clinicians 2023;73:17–48. https://doi.org/10.3322/caac.21763.
[3]Shain AH, Bastian BC. From melanocytes to melanomas. Nat Rev Cancer 2016;16:345–58. https://doi.org/10.1038/nrc.2016.37.
[4]Willsmore ZN, Coumbe BGT, Crescioli S, Reci S, Gupta A, Harris RJ, et al. Combined anti‐PD‐1 and anti‐CTLA‐4 checkpoint blockade: Treatment of melanoma and immune mechanisms of action. Eur J Immunol 2021;51:544–56. https://doi.org/10.1002/eji.202048747.
[5]Vinogradova T, Paul R, Grimaldi AD, Loncarek J, Miller PM, Yampolsky D, et al. Concerted effort of centrosomal and Golgi-derived microtubules is required for proper Golgi complex assembly but not for maintenance. MBoC 2012;23:820–33. https://doi.org/10.1091/mbc.E11-06-0550.
[6]Zhao JZ, Ye Q, Wang L, Lee SC. Centrosome amplification in cancer and cancer-associated human diseases. Biochimica et Biophysica Acta (BBA) - Reviews on Cancer 2021;1876:188566. https://doi.org/10.1016/j.bbcan.2021.188566.
[7]Mittal K, Kaur J, Sharma S, Sharma N, Wei G, Choudhary I, et al. Hypoxia Drives Centrosome Amplification in Cancer Cells via HIF1α-dependent Induction of Polo-Like Kinase 4. Mol Cancer Res 2022;20:596–606. https://doi.org/10.1158/1541-7786.MCR-20-0798.
[8]Denu RA, Shabbir M, Nihal M, Singh CK, Longley BJ, Burkard ME, et al. Centriole Overduplication is the Predominant Mechanism Leading to Centrosome Amplification in Melanoma. Mol Cancer Res 2018;16:517–27. https://doi.org/10.1158/1541-7786.MCR-17-0197.
[9]Ritchie ME, Phipson B, Wu D, Hu Y, Law CW, Shi W, et al. limma powers differential expression analyses for RNA-sequencing and microarray studies. Nucleic Acids Res 2015;43:e47–e47. https://doi.org/10.1093/nar/gkv007.
[10]Villanueva RAM, Chen ZJ. ggplot2: Elegant Graphics for Data Analysis (2nd ed.). Measurement: Interdisciplinary Research and Perspectives 2019;17:160–7. https://doi.org/10.1080/15366367.2019.1565254.
[11]Kolde R. pheatmap: Pretty Heatmaps 2019.
[12]Yan [aut L, cre. ggvenn: Draw Venn Diagram by “ggplot2” 2023.
[13]Yu G, Wang L-G, Han Y, He Q-Y. clusterProfiler: an R Package for Comparing Biological Themes Among Gene Clusters. OMICS: A Journal of Integrative Biology 2012;16:284–7. https://doi.org/10.1089/omi.2011.0118.
[14]Walter W, Sánchez-Cabo F, Ricote M. GOplot: an R package for visually combining expression data with functional analysis. Bioinformatics 2015;31:2912–4. https://doi.org/10.1093/bioinformatics/btv300.
[15]Shannon P, Markiel A, Ozier O, Baliga NS, Wang JT, Ramage D, et al. Cytoscape: A Software Environment for Integrated Models of Biomolecular Interaction Networks. Genome Res 2003;13:2498–504. https://doi.org/10.1101/gr.1239303.
[16]Therneau TM, until 2009) TL (original S->R port and R maintainer, Elizabeth A, Cynthia C. survival: Survival Analysis 2024.
[17]Friedman J, Hastie T, Tibshirani R. Regularization Paths for Generalized Linear Models via Coordinate Descent. J Stat Softw 2010;33:1–22.
[18]Gordon M, Lumley T. forestplot: Advanced Forest Plot Using “grid” Graphics 2023.
[19]Pawar A, Chowdhury OR, Salvi O. A narrative review of survival analysis in oncology using R. Cancer Research, Statistics, and Treatment 2022;5:554–61. https://doi.org/10.4103/crst.crst_230_22.
[20]Li L, Greene T, Hu B. A simple method to estimate the time-dependent receiver operating characteristic curve and the area under the curve with right censored data. Stat Methods Med Res 2018;27:2264–78. https://doi.org/10.1177/0962280216680239.
[21]Lu X, Wang Y, Jiang L, Gao J, Zhu Y, Hu W, et al. A Pre-operative Nomogram for Prediction of Lymph Node Metastasis in Bladder Urothelial Carcinoma. Front Oncol 2019;9. https://doi.org/10.3389/fonc.2019.00488.
[22]Jr FEH. rms: Regression Modeling Strategies 2024.
[23]Blanche P, Dartigues J, Jacqmin‐Gadda H. Estimating and comparing time‐dependent areas under receiver operating characteristic curves for censored event times with competing risks. Statistics in Medicine 2013;32:5381–97. https://doi.org/10.1002/sim.5958.
[24]Li R, Chen Y, Yang B, Li Z, Wang S, He J, et al. Integrated bioinformatics analysis and experimental validation identified CDCA families as prognostic biomarkers and sensitive indicators for rapamycin treatment of glioma. PLoS ONE 2024;19:e0295346. https://doi.org/10.1371/journal.pone.0295346.
[25]Hänzelmann S, Castelo R, Guinney J. GSVA: gene set variation analysis for microarray and RNA-Seq data. BMC Bioinformatics 2013;14:7. https://doi.org/10.1186/1471-2105-14-7.
[26]Aran D, Hu Z, Butte AJ. xCell: digitally portraying the tissue cellular heterogeneity landscape. Genome Biol 2017;18:220. https://doi.org/10.1186/s13059-017-1349-1.
[27]Kassambara A. ggpubr: “ggplot2” Based Publication Ready Plots 2023.
[28]Wei T, Simko V, Levy M, Xie Y, Jin Y, Zemla J, et al. corrplot: Visualization of a Correlation Matrix 2024.
[29]Yoshihara K, Shahmoradgoli M, Martínez E, Vegesna R, Kim H, Torres-Garcia W, et al. Inferring tumour purity and stromal and immune cell admixture from expression data. Nat Commun 2013;4:2612. https://doi.org/10.1038/ncomms3612.
[30]Geeleher P, Cox N, Huang RS. pRRophetic: An R Package for Prediction of Clinical Chemotherapeutic Response from Tumor Gene Expression Levels. PLoS ONE 2014;9:e107468. https://doi.org/10.1371/journal.pone.0107468.
[31]Zhang G, Wang Y, Chen B, Guo L, Cao L, Ren C, et al. Characterization of frequently mutated cancer genes in Chinese breast tumors: a comparison of Chinese and TCGA cohorts. Ann Transl Med 2019;7:179–179. https://doi.org/10.21037/atm.2019.04.23.
[32]Mayakonda A, Lin D-C, Assenov Y, Plass C, Koeffler HP. Maftools: efficient and comprehensive analysis of somatic variants in cancer. Genome Res 2018;28:1747–56. https://doi.org/10.1101/gr.239244.118.
[33]Hao Y, Hao S, Andersen-Nissen E, Mauck WM, Zheng S, Butler A, et al. Integrated analysis of multimodal single-cell data. Cell 2021;184:3573-3587.e29. https://doi.org/10.1016/j.cell.2021.04.048.
[34]Jin S, Guerrero-Juarez CF, Zhang L, Chang I, Ramos R, Kuan C-H, et al. Inference and analysis of cell-cell communication using CellChat. Nat Commun 2021;12:1088. https://doi.org/10.1038/s41467-021-21246-9.
[35]Trapnell C, Cacchiarelli D, Grimsby J, Pokharel P, Li S, Morse M, et al. The dynamics and regulators of cell fate decisions are revealed by pseudotemporal ordering of single cells. Nat Biotechnol 2014;32:381–6. https://doi.org/10.1038/nbt.2859.
[36]Tadesse S, Anshabo AT, Portman N, Lim E, Tilley W, Caldon CE, et al. Targeting CDK2 in cancer: challenges and opportunities for therapy. Drug Discovery Today 2020;25:406–13. https://doi.org/10.1016/j.drudis.2019.12.001.
[37]Matsumoto Y, Hayashi K, Nishida E. Cyclin-dependent kinase 2 (Cdk2) is required for centrosome duplication in mammalian cells. Current Biology 1999;9:429–32. https://doi.org/10.1016/s0960-9822(99)80191-2.
[38]Matsuura I, Denissova NG, Wang G, He D, Long J, Liu F. Cyclin-dependent kinases regulate the antiproliferative function of Smads. Nature 2004;430:226–31. https://doi.org/10.1038/nature02650.
[39]Qiu X, Li Y, Zhang Z. Crosstalk between oxidative phosphorylation and immune escape in cancer: a new concept of therapeutic targets selection. Cell Oncol 2023;46:847–65. https://doi.org/10.1007/s13402-023-00801-0.
[40]Liu X, Wang L, Zhao K, Thompson PR, Hwang Y, Marmorstein R, et al. The structural basis of protein acetylation by the p300/CBP transcriptional coactivator. Nature 2008;451:846–50. https://doi.org/10.1038/nature06546.
[41]Wu Y, Wang X, Xu F, Zhang L, Wang T, Fu X, et al. The regulation of acetylation and stability of HMGA2 via the HBXIP-activated Akt–PCAF pathway in promotion of esophageal squamous cell carcinoma growth. Nucleic Acids Res 2020;48:4858–76. https://doi.org/10.1093/nar/gkaa232.
[42]Hu H, Zhu W, Qin J, Chen M, Gong L, Li L, et al. Acetylation of PGK1 promotes liver cancer cell proliferation and tumorigenesis. Hepatology 2017;65:515–28. https://doi.org/10.1002/hep.28887.
[43]Jia Y-L, Xu M, Dou C-W, Liu Z-K, Xue Y-M, Yao B-W, et al. P300/CBP-associated factor (PCAF) inhibits the growth of hepatocellular carcinoma by promoting cell autophagy. Cell Death Dis 2016;7:e2400–e2400. https://doi.org/10.1038/cddis.2016.247.
[44]Li Y-H, Li Y-X, Li M, Song S, Ge Y, Jin J, et al. The Ras-ERK1/2 signaling pathway regulates H3K9ac through PCAF to promote the development of pancreatic cancer. Life Sciences 2020;256:117936. https://doi.org/10.1016/j.lfs.2020.117936.
[45]Fan X, Barshop WD, Vashisht AA, Pandey V, Leal S, Rayatpisheh S, et al. Iron-regulated assembly of the cytosolic iron–sulfur cluster biogenesis machinery. Journal of Biological Chemistry 2022;298:102094. https://doi.org/10.1016/j.jbc.2022.102094.
[46]Christodoulou A, Lederer CW, Surrey T, Vernos I, Santama N. Motor protein KIFC5A interacts with Nubp1 and Nubp2, and is implicated in the regulation of centrosome duplication. J Cell Sci 2006;119:2035–47. https://doi.org/10.1242/jcs.02922.
[47]Fukasawa K. Centrosome amplification, chromosome instability and cancer development. Cancer Letters 2005;230:6–19. https://doi.org/10.1016/j.canlet.2004.12.028.
[48]Tsai J-J, Hsu W-B, Liu J-H, Chang C-W, Tang TK. CEP120 interacts with C2CD3 and Talpid3 and is required for centriole appendage assembly and ciliogenesis. Sci Rep 2019;9:6037. https://doi.org/10.1038/s41598-019-42577-0.
[49]Sharma A, Gerard SF, Olieric N, Steinmetz MO. Cep120 promotes microtubule formation through a unique tubulin binding C2 domain. Journal of Structural Biology 2018;203:62–70. https://doi.org/10.1016/j.jsb.2018.01.009.
[50]Hanahan D, Weinberg RA. Hallmarks of Cancer: The Next Generation. Cell 2011;144:646–74. https://doi.org/10.1016/j.cell.2011.02.013.
[51]Jorgovanovic D, Song M, Wang L, Zhang Y. Roles of IFN-γ in tumor progression and regression: a review. Biomark Res 2020;8:49. https://doi.org/10.1186/s40364-020-00228-x.
[52]Cheng H, Wang Z, Fu L, Xu T. Macrophage Polarization in the Development and Progression of Ovarian Cancers: An Overview. Front Oncol 2019;9:421. https://doi.org/10.3389/fonc.2019.00421.
[53]St. Paul M, Ohashi PS. The Roles of CD8+ T Cell Subsets in Antitumor Immunity. Trends in Cell Biology 2020;30:695–704. https://doi.org/10.1016/j.tcb.2020.06.003.
[54]Tumeh PC, Harview CL, Yearley JH, Shintaku IP, Taylor EJM, Robert L, et al. PD-1 blockade induces responses by inhibiting adaptive immune resistance. Nature 2014;515:568–71. https://doi.org/10.1038/nature13954.
[55]Weber JS, D’Angelo SP, Minor D, Hodi FS, Gutzmer R, Neyns B, et al. Nivolumab versus chemotherapy in patients with advanced melanoma who progressed after anti-CTLA-4 treatment (CheckMate 037): a randomised, controlled, open-label, phase 3 trial. The Lancet Oncology 2015;16:375–84. https://doi.org/10.1016/S1470-2045(15)70076-8.
Peer-review Terminology
Identity transparency: Single anonymized
Reviewer interacts with: Editor
Details
This is an open access article under the terms of the Creative Commons Attribution License(http://creativecommons.org/licenses/by/4.0/), which permits use, distribution and reproduction in any medium, provided the original work is properly cited.
Publication History
Received 2025-03-25
Accepted 2025-04-29
Published 2025-05-14