


Abstract
Background:Breast cancer is a major malignancy among women worldwide. Despite therapeutic advances, resistance to 5-fluorouracil (5-Fu) limits treatment efficacy. Lipid metabolism reprogramming may play a critical role in this resistance, but its mechanisms remain unclear.
Methods:We integrated single-cell sequencing data and multi-omics analysis to explore molecular characteristics associated with 5-Fu resistance. Differential gene expression analysis and Cox regression were used to construct a prognostic risk model, validated in independent cohorts.
Results:We developed a three-gene prognostic model (PDLIM4, SDC1, EMP1) with robust predictive performance. High-risk scores were associated with elevated lipid metabolism and distinct immune microenvironment features.
Conclusion:Lipid metabolism reprogramming contributes to 5-Fu resistance in breast cancer. Our model offers a tool for risk assessment and a potential basis for therapeutic strategies targeting lipid metabolism.
Keywords:Breast cancer; 5-Fluorouracil; Lipid metabolism; Prognostic model; Chemotherapy resistance; Single-cell sequencing
Introduction
Breast cancer is a major global health issue, with approximately 2.3 million new cases in 2022, making it the second most common cancer after lung cancer[1] . In China, it ranks second in incidence and fifth in mortality among female cancers[2] . Despite improved diagnostics leading to lower mortality rates, breast cancer incidence continues to rise, particularly among younger women, largely due to aging populations and lifestyle changes[3] . This underscores the need for deeper understanding of its underlying molecular mechanisms.
Although treatment methods have advanced, chemotherapy resistance remains a significant clinical challenge[4] . 5-Fu, an essential chemotherapy drug, inhibits thymidylate synthase to disrupt DNA synthesis[5] . However, resistance to 5-Fu severely limits its effectiveness and contributes substantially to cancer-related mortality[6] . Thus, clarifying the mechanisms of 5-Fu resistance and identifying reliable biomarkers are crucial to improving patient prognosis.
Lipid metabolism reprogramming is a key driver of chemotherapy resistance, particularly to 5-Fu treatment, where cancer cells adapt by accumulating lipid droplets under chemotherapeutic stress[7] . For example, 5-Fu-resistant colorectal cancer cells show elevated sphingolipids and reduced ceramides mediated by SMPD1[8] . Additionally, lipid metabolic alterations can influence cell membrane fluidity, drug uptake, oxidative stress, and apoptosis pathways, collectively forming a protective mechanism against 5-Fu treatment[9] .Understanding these metabolic adaptations not only clarifies resistance mechanisms but also guides potential therapeutic strategies targeting lipid metabolism to enhance chemotherapy efficacy.
In this study, we integrated lipid metabolism-related genes from public databases to construct a prognostic model predicting 5-Fu resistance in breast cancer. Through differential expression analysis and Cox regression, we identified key prognostic genes and validated our risk-scoring model using ROC curve and Kaplan-Meier analyses in external cohorts. We further developed a nomogram to facilitate clinical use. Additionally, functional enrichment, protein-protein interaction analyses, and immune microenvironment comparisons were conducted to clarify the biological mechanisms of identified genes. Our model provides a valuable tool for individualized prognosis and therapeutic decisions in breast cancer.
Materials and Methods
Data Sources and Collection
The GSE243526 single-cell RNA sequencing dataset was obtained from the Gene Expression Omnibus (GEO)[10] to identify 5-Fu-resistant and -sensitive tumor subpopulations. Lipid metabolism-related genes (n = 16,338) were retrieved from GeneCards[11] . Bulk RNA-seq data, along with clinical features and survival information of breast cancer (BRCA) patients, were downloaded from The Cancer Genome Atlas (TCGA) using the easyTCGA package and served as the primary dataset for model construction. The external validation cohort, GSE103091, was also retrieved from GEO and included expression profiles and follow-up data. Detailed sample information is presented in Table 1.
Table 1. Sample Information from TCGA-BRCA and GEO Databases
|
Database |
Information |
|
GSE243526 |
Single-cell sequencing samples (n=16): breast cancer tissues (n=12) and normal breast tissues (n=4)
|
|
TCGA-BRCA |
RNA-bulk-Seq samples (n=1231): tumor samples (n=1118) and normal samples (n=113) Clinical characteristics of tumor samples(n=906)
|
|
GSE103091 |
Expression profiling microarray samples with survival information (n=107) |
Single-Cell RNA Sequencing Dataset Analysis
The GSE243526 single-cell RNA sequencing dataset was analyzed to identify gene expression differences associated with 5-Fu resistance. Quality control was conducted using the Seurat V5 framework. Cells were retained if they had between 300 and 7000 detected genes, less than 20% mitochondrial gene expression, less than 3% hemoglobin gene expression, and sequencing depth above 1000. Batch effects were corrected using the Harmony algorithm.
Cell type annotation was based on cluster-specific marker genes. Malignant epithelial cells were identified by comparison with normal myoepithelial cells. Chromosomal copy number variations (CNVs) were evaluated using the inferCNV algorithm. CNV scores were calculated by normalizing gene-level signals to the [−1,1] interval and summing the squared CNV values across all genes in each cell. Uniform Manifold Approximation and Projection (UMAP) was used for dimensionality reduction and visualization of cell subpopulations.
Following reclustering of malignant epithelial cells, the Scissor algorithm was applied to classify 5-Fu-resistant and -sensitive subpopulations. Scissor integrates single-cell expression profiles, bulk transcriptomic data, and phenotypic responses such as drug sensitivity to identify phenotype-associated cell populations[12] . Specifically, the single-cell expression matrix of malignant epithelial cells, bulk RNA-seq data from the Genomics of Drug Sensitivity in Cancer (GDSC) database, and IC50 values for 5-Fu were jointly used. Cells identified as Scissor+ were labeled as resistant (epi_5-fu_Res), whereas Scissor− and unclassified cells were grouped as sensitive (epi_5-fu_Sen).
Differential gene expression between the resistant and sensitive groups was analyzed using the FindMarkers function in Seurat. Genes were retained if they showed |log2 fold change| > 0.25, were expressed in at least 25% of cells, had an intergroup expression proportion difference >10%, and a p-value < 0.05 by Wilcoxon rank-sum test.
DEGs Identification and Core Gene Set Screening
Differential expression analysis was performed on the TCGA-BRCA dataset using the DESeq2 package, with significant genes defined as those with |log₂FC| > 0.5 and p < 0.05. A multi-set intersection was then conducted among three gene sets: differentially expressed genes from TCGA-BRCA, 5-Fu resistance–associated genes identified from single-cell analysis, and lipid metabolism–related genes. Overlapping genes were considered candidates related to both 5-Fu resistance and lipid metabolism. The intersections were visualized using Venn diagrams generated with the VennDiagram package.
Subsequently, functional enrichment analysis was conducted on the candidate genes using the clusterProfiler package. GO terms and KEGG pathways with p-values < 0.05 were considered significant, and the top 10 terms were visualized using ggplot2. Protein-protein interaction (PPI) analysis was conducted via the STRING database[13] with an interaction score cutoff of ≥ 0.4. The PPI network was visualized using Cytoscape, with node size and color intensity representing protein importance..
Development and Validation of a Prognostic Risk Signature
Univariate Cox regression was conducted using the survival package to identify genes significantly associated with 5-Fu resistance and lipid metabolism (p < 0.05). Genes meeting the proportional hazards (PH) assumption, assessed via Schoenfeld residuals (p > 0.05), were further included in multivariate Cox regression. PH assumption was re-evaluated in the multivariate model, and independent prognostic factors (p < 0.05) were visualized in forest plots using the forestploter package, showing hazard ratios (HR) and 95% confidence intervals.
A prognostic risk score was constructed using coefficients from multivariate Cox regression: Risk score=(−0.224×PDLIM4)+(0.166×SDC1)+(0.204×EMP1).Patients in both the TCGA-BRCA training set and GSE103091 validation set were divided into high- and low-risk groups based on the median risk score. Overall survival (OS) differences between groups were assessed using Kaplan-Meier analysis and log-rank tests via the survminer package. The predictive accuracy of the signature at 1-, 3-, and 5-year intervals was evaluated using time-dependent ROC curves generated with the survivalROC package.
Gene Expression and Survival Risk Analysis
To evaluate the prognostic model and risk stratification effectiveness, several visualization methods were applied. Risk score distribution and survival status were visualized using the survminer and forestploter packages, allowing assessment of patient distribution and corresponding outcomes. Heatmaps of the key genes in the model were generated with the pheatmap package, highlighting differential expression patterns between high- and low-risk groups.
Additionally, principal component analysis (PCA) was performed for three-dimensional visualization. Samples were projected onto the space defined by the top three principal components to illustrate the separation and clustering of risk groups in multidimensional gene expression space.
Construction of a Nomogram Model
Patients with complete clinical and survival data were selected from the TCGA-BRCA cohort. Risk scores and clinical variables were analyzed using univariate Cox regression to identify factors significantly associated with overall survival (p < 0.05), and results were visualized in forest plots via the survminer and forestploter packages. Variables satisfying the proportional hazards (PH) assumption, assessed using Schoenfeld residuals, were included in a multivariate Cox regression model. PH assumptions were reassessed to ensure model stability, and independent prognostic factors were identified.
A nomogram was constructed using the rms and regplot packages based on these independent predictors. Model performance was evaluated using time-dependent ROC curves (via survivalROC) at 1-, 3-, and 5-year intervals, calibration plots, and decision curve analysis (DCA) with the ggDCA package, confirming its potential for clinical application in breast cancer prognosis.
Immune Correlation Analysis
To evaluate the relationship between risk stratification and the tumor immune microenvironment, immune infiltration profiles were compared between high- and low-risk groups in the TCGA-BRCA cohort. Using the IOBR package [14] , the relative proportions of 22 immune cell types were quantified via the CIBERSORT algorithm. Immune cell compositions across samples were visualized using stacked bar plots to display overall differences between risk groups.
Spearman correlation analysis was performed to assess interactions among immune cells, and the results were visualized as correlation heatmaps using the corrplot package. Correlation strength (|r| ≥ 0.3) and significance levels (p < 0.05, 0.01, 0.001) were annotated. Differences in immune cell abundance between risk groups were evaluated using the Wilcoxon rank-sum test, with results presented in box plots.
The associations between prognostic genes (PDLIM4, SDC1, and EMP1) and immune cell infiltration levels were further analyzed via Spearman correlation, and results were illustrated in heatmaps. Additionally, correlation coefficients between risk scores and immune cell proportions were calculated to identify immune cell types significantly associated with the risk score (|r| > 0.3, p < 0.05), suggesting potential biological links between the risk model and specific immune features.
Functional Enrichment and Pathway Activity Analysis
To explore molecular pathway activity across different risk groups, functional enrichment analysis was performed. Patients from the TCGA-BRCA cohort were stratified into high- and low-risk groups based on the prognostic risk score. Differentially expressed genes (DEGs) between the two groups were identified using DESeq2, with cutoffs of |log2FC| > 0.5 and p < 0.05. Results were visualized as volcano plots using ggplot2 and ggrepel.
KEGG enrichment analysis was conducted separately for upregulated and downregulated DEGs using clusterProfiler and org.Hs.eg.db. The top 10 enriched pathways and their associated genes were visualized using the GOChord function from the GOplot package.
Additionally, Gene Set Enrichment Analysis (GSEA) was performed based on ranked genes calculated as −log10(p-value) × sign(log2FC). The MsigDB KEGG gene set (c2.cp.kegg.v7.4.symbols.gmt) was used for reference. GSEA results were visualized via the gseaNb function in the GseaVis package, and significantly enriched pathways in the high-risk group were defined as those with NES > 1, p < 0.05, and FDR < 0.25.
Protein Expression Validation and Functional Network Analysis
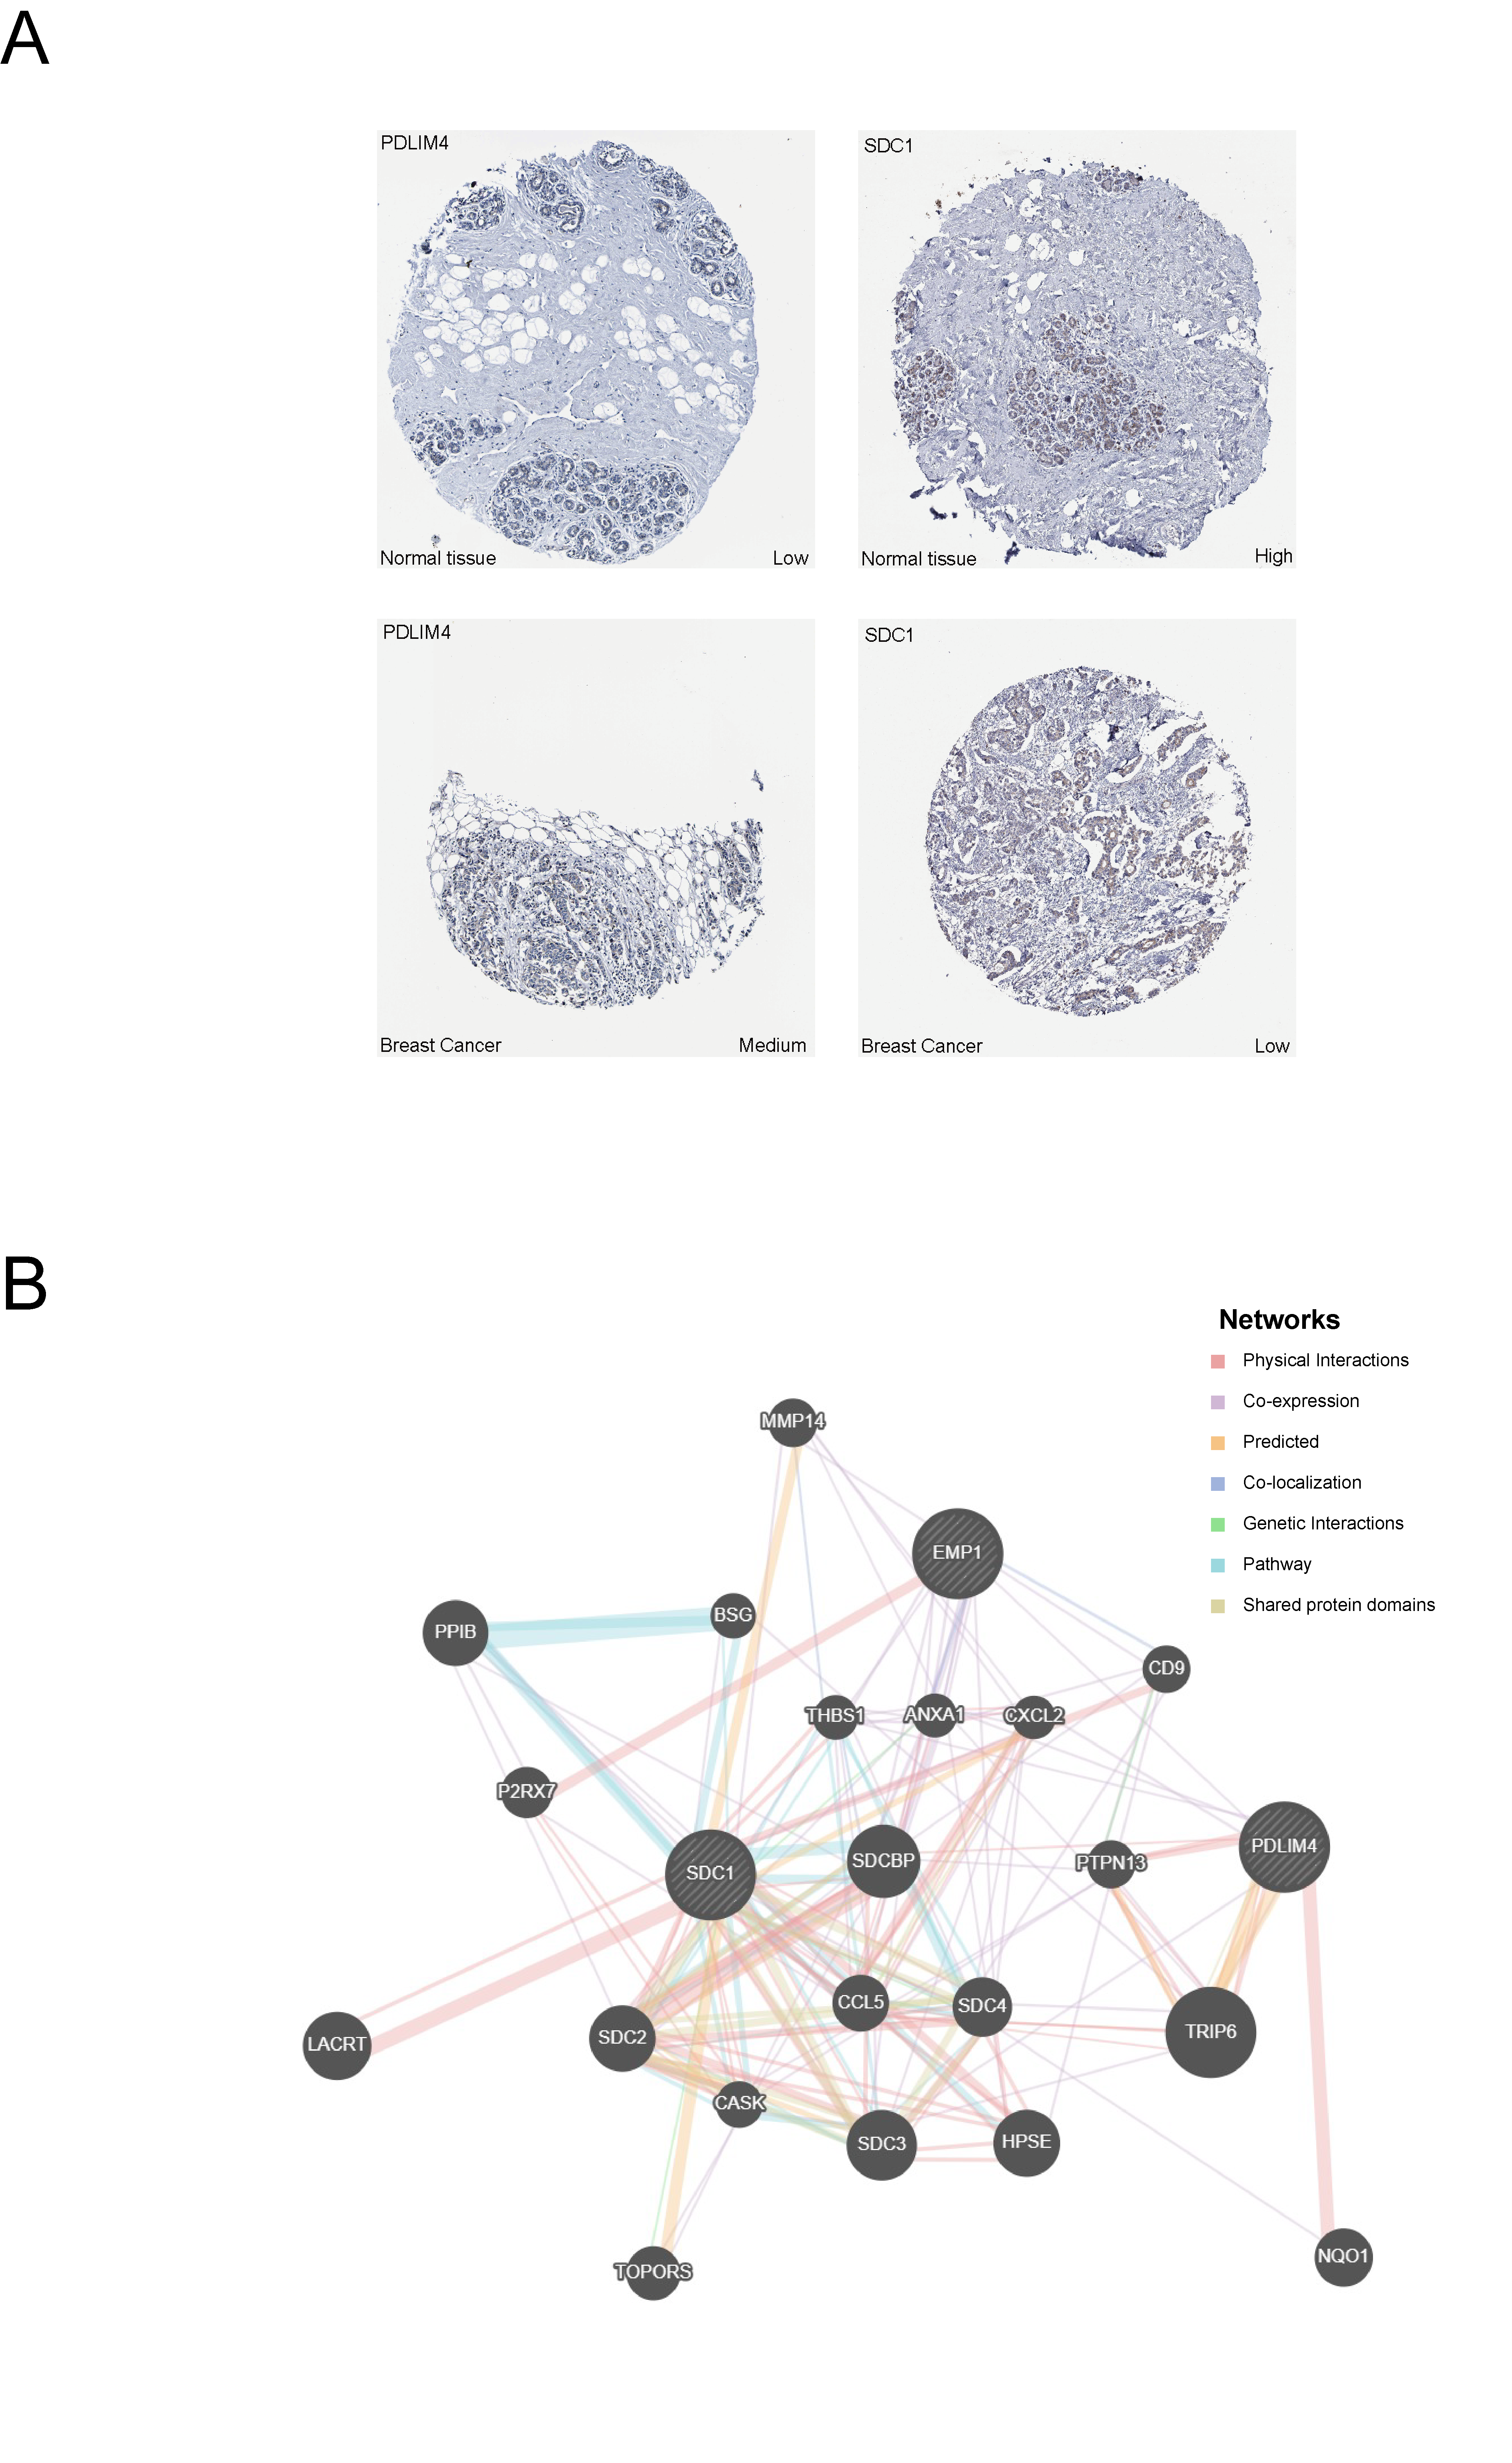
To validate the expression of prognostic genes at the protein level, immunohistochemical data were obtained from the Human Protein Atlas (HPA) database. Protein expression patterns in normal and breast cancer tissues were compared to evaluate their potential roles in tumor development. Functional network analysis was performed using GeneMANIA [15] to investigate biological associations of the prognostic genes. This analysis incorporated multiple data types, including physical interactions, co-expression, co-localization, pathway co-occurrence, and protein domain similarity, to construct a functional association network. Key functional partners were identified, along with their involvement in major biological processes, molecular functions, and cellular components..
Statistical Analysis
All statistical analyses and visualizations were performed using R (version 4.4.0) and RStudio (version 2024.12.1+563), along with relevant online databases. A two-sided p-value < 0.05 was considered statistically significant. Significance levels were indicated as follows: p < 0.05 (*), p < 0.01 (**), p < 0.001 (***), and p < 0.0001 (****).
Results
Identification of Differential Genes Associated with 5-Fu Resistance through Single-Cell Data Analysis
Differential gene expression associated with 5-FU resistance was investigated using the GSE243526 single-cell RNA sequencing dataset. After rigorous quality control, 123,901 high-quality cells were retained for analysis (Figure 1A). Batch effects were corrected through multi-sample integration, confirmed by UMAP visualization (Figure 1B).
Cells were clustered using a resolution of 0.2, resulting in 15 initial clusters (Figure 1C). Based on marker gene expression, 10 distinct cell types were annotated (Figure 1D–E), including B cells, T cells, macrophages, mast cells, fibroblasts, endothelial cells, pericytes, luminal epithelial cells, myoepithelial cells, and cancer cells. Cancer cells were identified via chromosomal copy number variation (CNV) analysis using inferCNV.
Figure 1. Preliminary single-cell transcriptomic analysis of 5-FU resistance mechanisms in breast cancer(A) Quality control workflow diagram showing 123,901 high-quality cells retained after multi-parameter filtration.(B) UMAP dimensionality reduction plot after multi-sample integration demonstrating batch effect elimination.(C) UMAP visualization of 15 initial cell clusters obtained using optimized clustering parameters (resolution=0.2).(D) UMAP plot of 10 annotated cell subpopulations.(E) Heatmap of cell type-specific marker gene expression.
Subsequent analysis of epithelial subpopulations (Supplementary Figure 1A–F) refined luminal epithelial clusters into 16 subgroups. Subgroups 0, 2, 7, 9, and 15 exhibited CNV profiles similar to normal epithelial tissue and were classified as normal luminal cells. Remaining clusters were deemed malignant, while mixed subgroups (5 and 13) were excluded to improve clustering accuracy.
Reclustering of cancer cells revealed 11 subgroups (Figure 2A–B). Using the Scissor algorithm, cells were classified into 5-FU-resistant and -sensitive subpopulations based on similarity to bulk expression and drug sensitivity data (Figure 2C). Their spatial distribution was visualized via UMAP (Figure 2D). Differential expression analysis between resistant and sensitive clusters identified 84 5-FU resistance–associated genes (Figure 2E).
Figure 2. Identification and characterization of 5-FU resistant cancer cell subpopulations(A) Integration status of samples after cancer cell reclustering.(B) Distribution characteristics of 11 cancer cell subgroups.(C) Correlation assessment between individual cancer cells and 5-FU resistance using the Scissor algorithm.(D) Spatial distribution patterns of 5-FU resistant and sensitive cell clusters.(E) Volcano plot depicting 84 differentially expressed genes significantly associated with 5-FU resistance.
Identification of Candidate Genes Linking 5-FU Resistance to Lipid Metabolism
Differential expression analysis of the TCGA-BRCA dataset identified 5,985 upregulated and 3,591 downregulated genes in breast cancer samples. These results were visualized using a volcano plot (Figure 3A) and a heatmap of the top 10 upregulated and downregulated genes (Figure 3B).
A multi-set intersection analysis was performed among three gene sets: differentially expressed genes from TCGA-BRCA, 5-FU resistance–associated genes identified from single-cell analysis, and lipid metabolism–related genes from GeneCards. This integrative approach identified 42 candidate genes associated with both 5-FU resistance and lipid metabolism (Figure 3C).
Protein-protein interaction (PPI) analysis of these 42 genes was conducted using the STRING database (Figure 3D). The resulting network revealed HSPA1A and FOS as central hub proteins, interacting with multiple partners, suggesting their key regulatory roles in lipid metabolism and 5-FU resistance.
Gene Ontology (GO) and Kyoto Encyclopedia of Genes and Genomes (KEGG) enrichment analyses were then performed. GO analysis revealed 23 enriched pathways, with the top 10 involving processes such as response to metal ions, protein folding, and cAMP signaling (Figure 3E). KEGG analysis identified 12 pathways, with the top 10 enriched in estrogen signaling, proteoglycans in cancer, and cell adhesion molecules (Figure 3F).
Figure 3. Identification of Candidate Genes Linking 5-FU Resistance to Lipid Metabolism(A) Volcano plot illustrating differential gene expression in the TCGA-BRCA dataset.(B) Heatmap displaying the TOP10 upregulated and TOP10 downregulated genes from the TCGA-BRCA dataset.(C) Venn diagram of intersection analysis between TCGA-BRCA differentially expressed genes, 5-FU resistance-associated genes from single-cell analysis, and Genecard lipid metabolism-related genes.(D) Protein-protein interaction network of the 42 candidate genes constructed using the STRING database(E) TOP10 GO enrichment pathways of the 42 candidate genes.(F) TOP10 KEGG enrichment pathways of the 42 candidate genes
Identification of Prognostic Genes and Construction of Risk Prediction Model
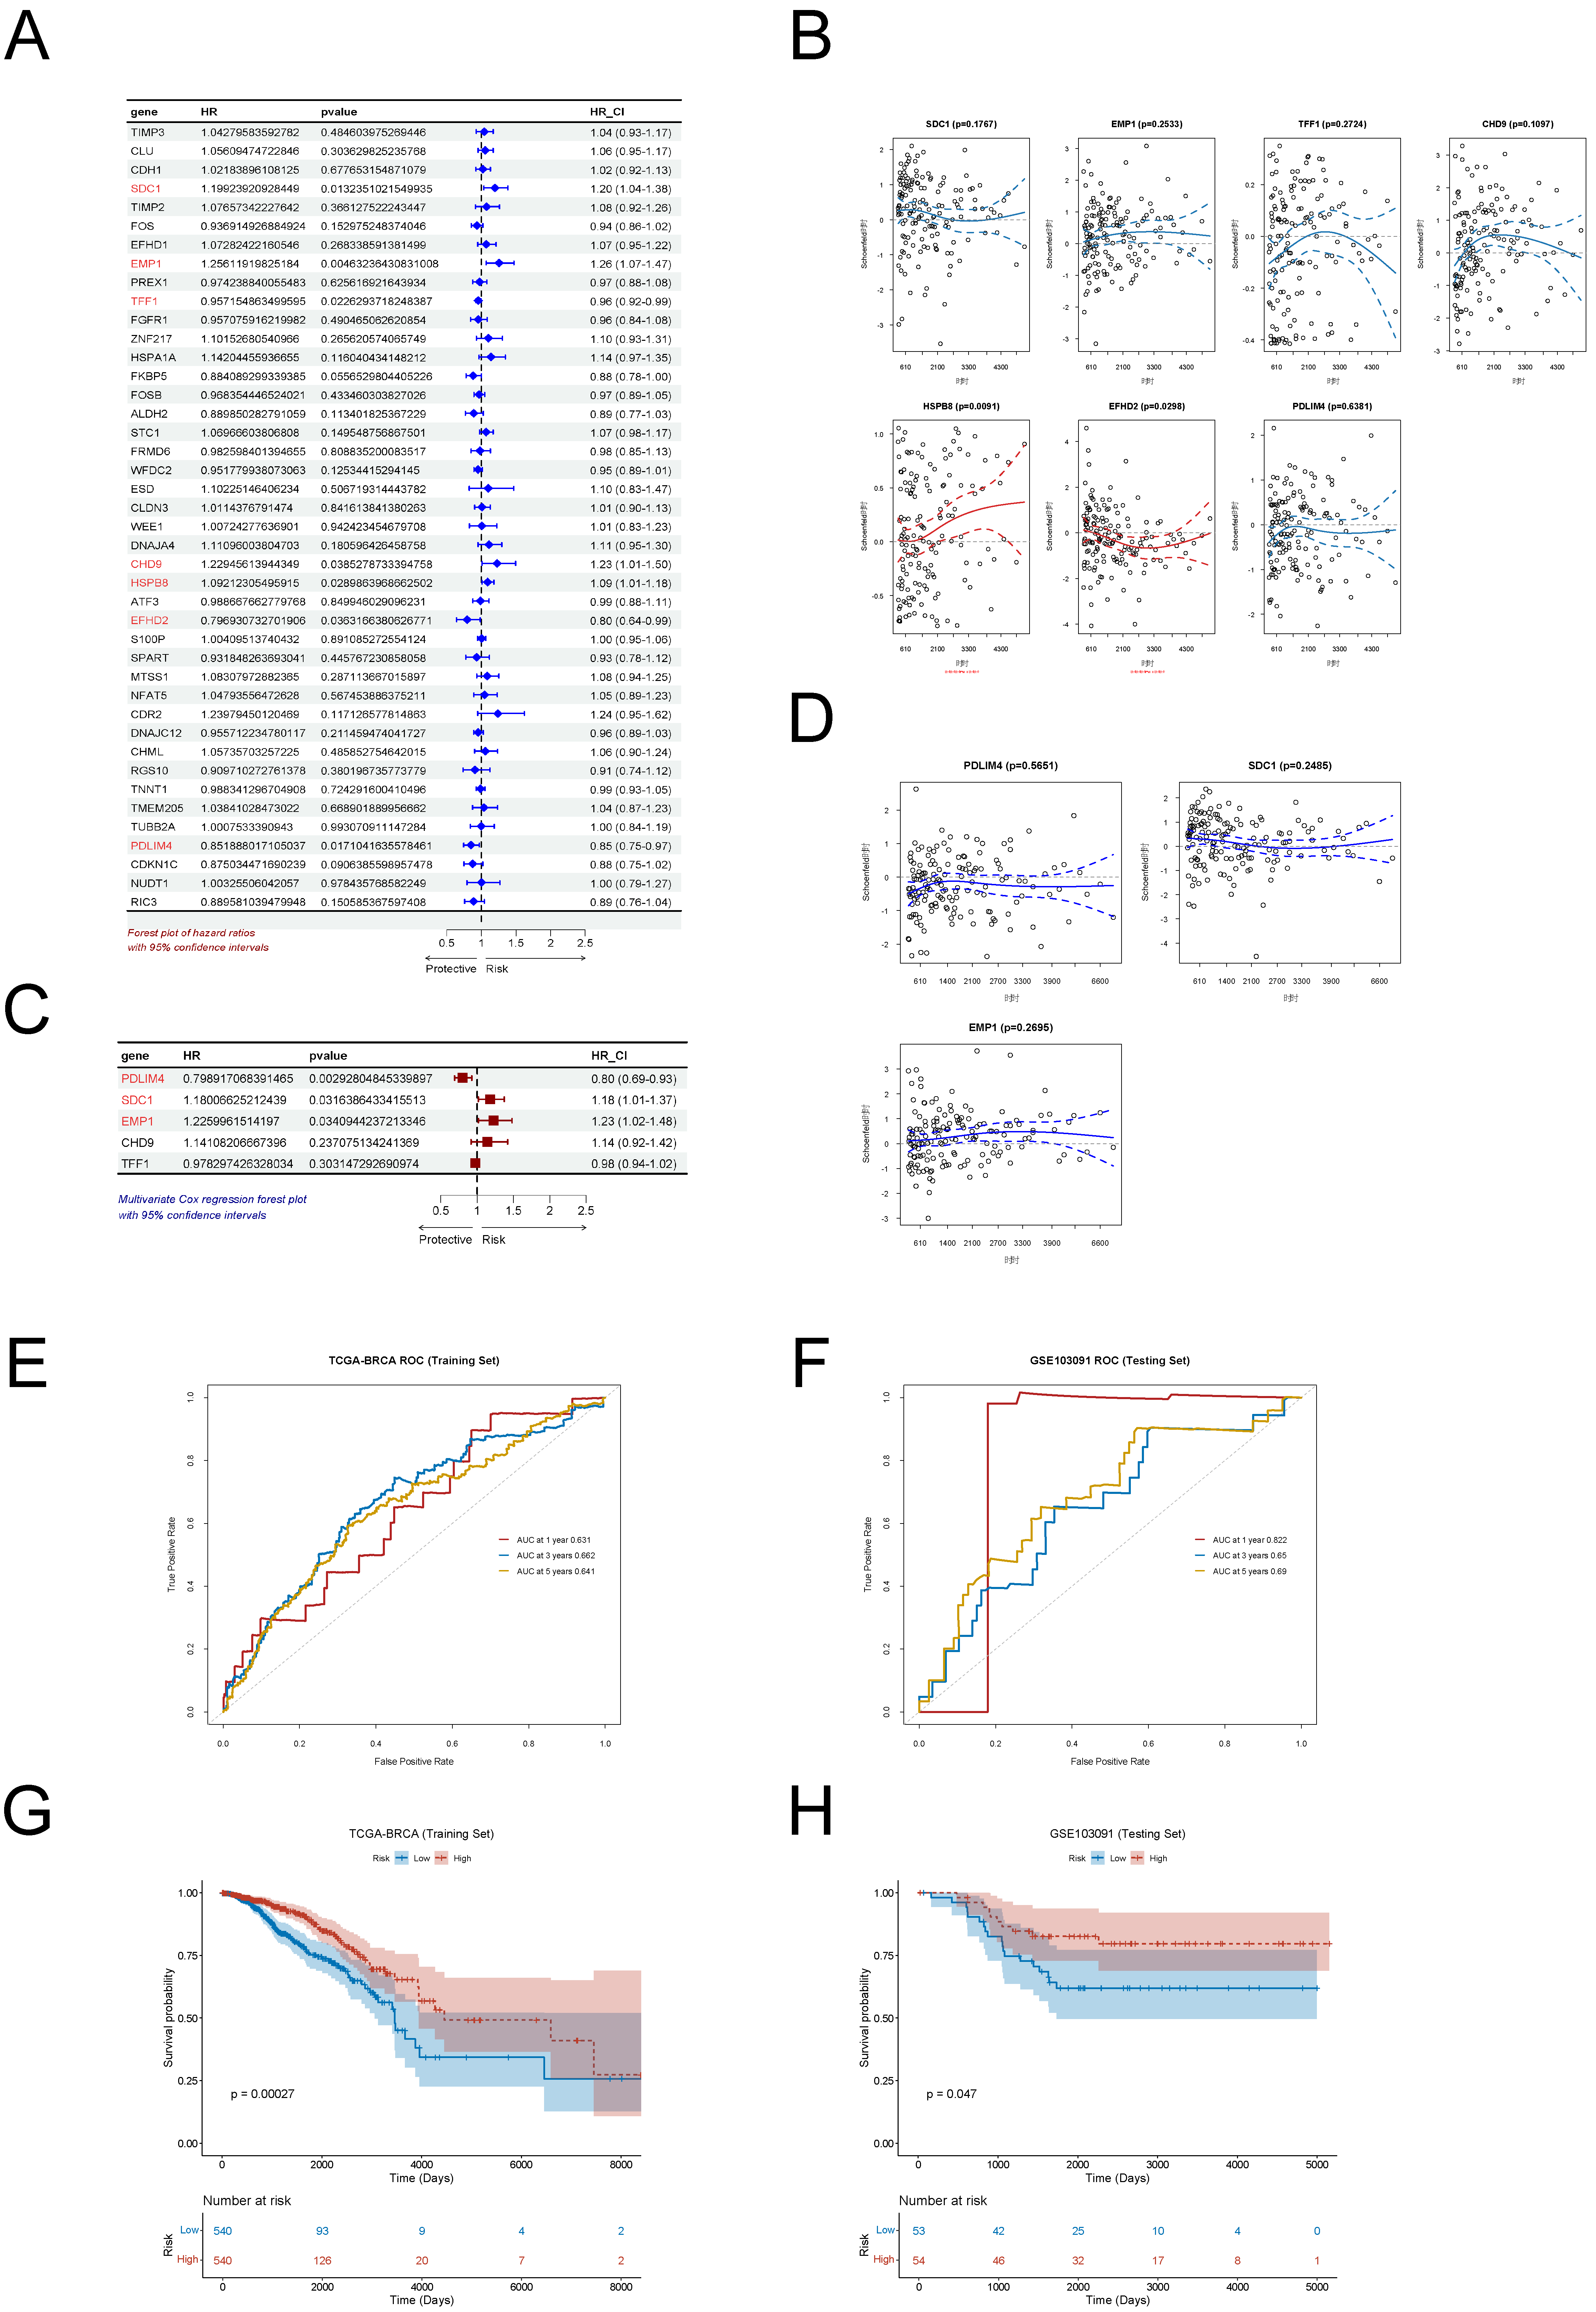
Univariate Cox regression analysis identified seven prognostic gene candidates (Figure 4A). Following proportional hazards (PH) assumption testing, HSPB8 and EFHD2 were excluded due to non-compliance (p < 0.05; Figure 4B). Multivariate Cox regression on the remaining five genes identified PDLIM4, SDC1, and EMP1 as independent prognostic factors (igure 4C), all of which met the PH assumption (Figure 4D).
A prognostic risk model was developed using the expression levels and regression coefficients of these three genes. Risk scores were calculated for each patient, and individuals were stratified into high- and low-risk groups based on the median score. Receiver operating characteristic (ROC) curve analysis showed good predictive performance in the TCGA-BRCA training set, with AUCs of 0.631, 0.662, and 0.641 at 1, 3, and 5 years, respectively (Figures 4E–F). In the external validation cohort GSE103091, AUCs were 0.822, 0.65, and 0.69 at corresponding time points. These results demonstrate the model’s stable discriminative power across short- and long-term survival. Kaplan–Meier survival analysis confirmed significantly shorter overall survival in the high-risk group compared to the low-risk group in both the training (p = 0.00027) and validation (p = 0.047) sets (Figures 4G–H), as determined by log-rank test.
Figure 4. Development and Validation of a Three-Gene Prognostic Model(A) Forest plot of univariate Cox regression analysis identifying prognostic gene markers.(B) Proportional hazards assumption testing results for candidate genes.(C) Forest plot of multivariate Cox regression analysis identifying independent prognostic genes.(D) Proportional hazards assumption verification for the final selected genes.(E) Time-dependent ROC curves for the risk prediction model in the TCGA-BRCA training cohort.(F) Time-dependent ROC curves for the risk prediction model in the GSE103091 validation cohort.(G) Kaplan-Meier survival curves comparing high-risk and low-risk groups in the TCGA-BRCA training cohort.(H) Kaplan-Meier survival curves comparing high-risk and low-risk groups in the GSE103091 validation cohort.
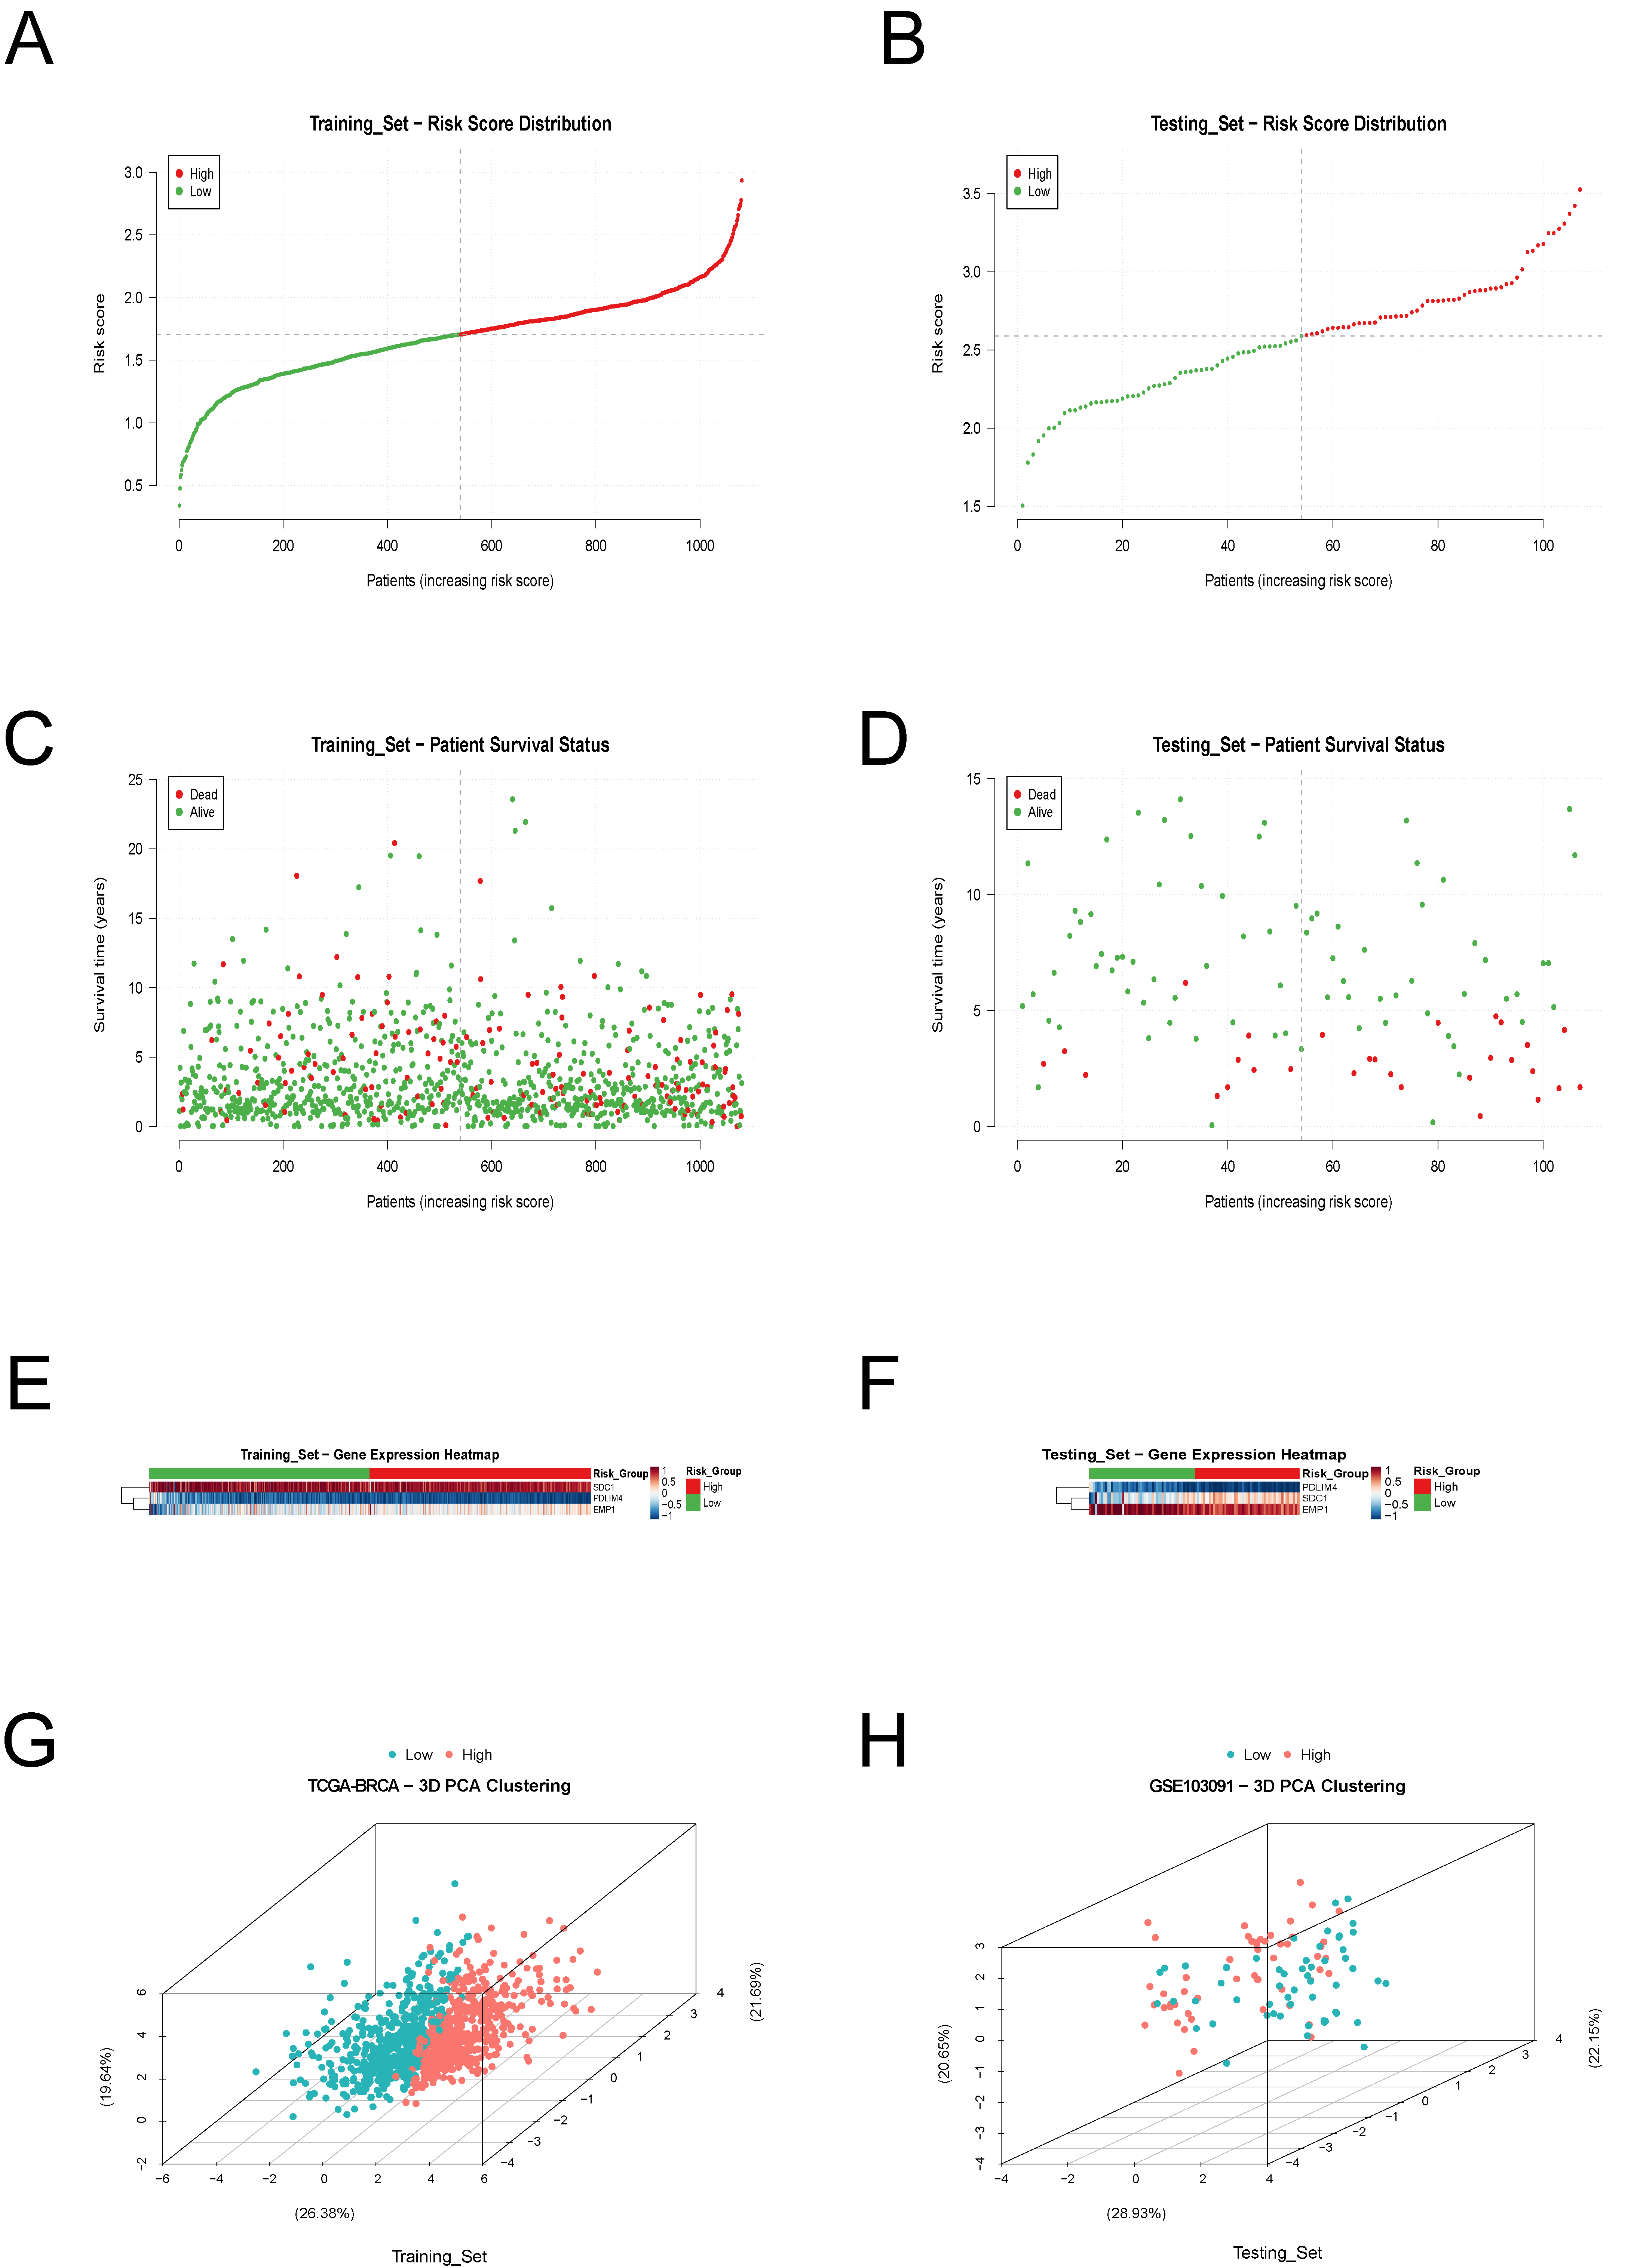
Further visualization of the model included risk score distribution, survival status, gene expression heatmaps, and principal component analysis (PCA). Risk score plots (Figures 5A–B) showed a gradient distribution from low- to high-risk. Survival scatter plots (Figures 5C–D) indicated a higher concentration of death events in the high-risk group. Heatmaps (Figures 5E–F) revealed distinct expression patterns of the three prognostic genes. Three-dimensional PCA (Figures 5G–H) confirmed clear separation between high- and low-risk groups, validating the model’s discriminative capacity and generalizability across independent datasets.
Figure 5. Risk Score Analysis and Model Performance Visualization.(A) Risk score distribution plot for patients in the TCGA-BRCA training cohort.(B) Risk score distribution plot for patients in the GSE103091 validation cohort.(C) Survival status scatter plot for patients in the TCGA-BRCA training cohort.(D) Survival status scatter plot for patients in the GSE103091 validation cohort.(E) Heatmap showing expression patterns of the three key genes in the TCGA-BRCA training cohort.(F) Heatmap showing expression patterns of the three key genes in the GSE103091 validation cohort.(G) Three-dimensional principal component analysis (PCA) of risk groups in the TCGA-BRCA training cohort.(H) Three-dimensional principal component analysis (PCA) of risk groups in the GSE103091 validation cohort.
Construction and Validation of a Nomogram Model
To evaluate the risk score as an independent prognostic factor in breast cancer, univariate and multivariate Cox regression analyses were performed using the complete TCGA cohort. Univariate analysis (Figure 6A) identified T stage, N stage, M stage, age, pathological stage, and risk score as significant predictors of overall survival (p < 0.001), while molecular subtype was not statistically significant (p = 0.063). Proportional hazards (PH) assumption testing (Figure 6B) indicated that T stage and pathological stage violated the assumption (p < 0.05). Multivariate Cox analysis (Figure 6C) confirmed that N stage, M stage, age, and risk score were independent prognostic factors, all meeting the PH assumption (Figure 6D).
A Nomogram was constructed incorporating age, N stage, M stage, and risk score to predict 1-, 3-, and 5-year overall survival (Figure 6E). Calibration plots demonstrated good agreement between predicted and observed survival outcomes (Figure 6F). Time-dependent ROC curves showed AUCs of 0.797, 0.757, and 0.766 for 1-, 3-, and 5-year survival, respectively, indicating favorable discrimination performance (Figure 6G). Decision curve analysis (Figure 6H) confirmed that the Nomogram achieved stable net clinical benefit across all time points, outperforming treat-all or treat-none strategies within clinically relevant risk thresholds.
Figure 6. Development of a Nomogram Model.(A) Forest plot of univariate Cox regression analysis for clinicopathological characteristics and risk score.(B) Proportional hazards assumption testing results for clinical variables.(C) Forest plot of multivariate Cox regression analysis identifying independent prognostic factors.(D) Proportional hazards assumption verification for the final selected variables.(E) Nomogram integrating age, N stage, M stage, and risk score for predicting 1-year, 3-year, and 5-year overall survival.(F) Calibration curves for the Nomogram model at 1-year, 3-year, and 5-year time points.(G) Time-dependent ROC curves for the Nomogram model showing discriminative ability.(H) Decision curve analysis demonstrating the clinical utility of the Nomogram model.
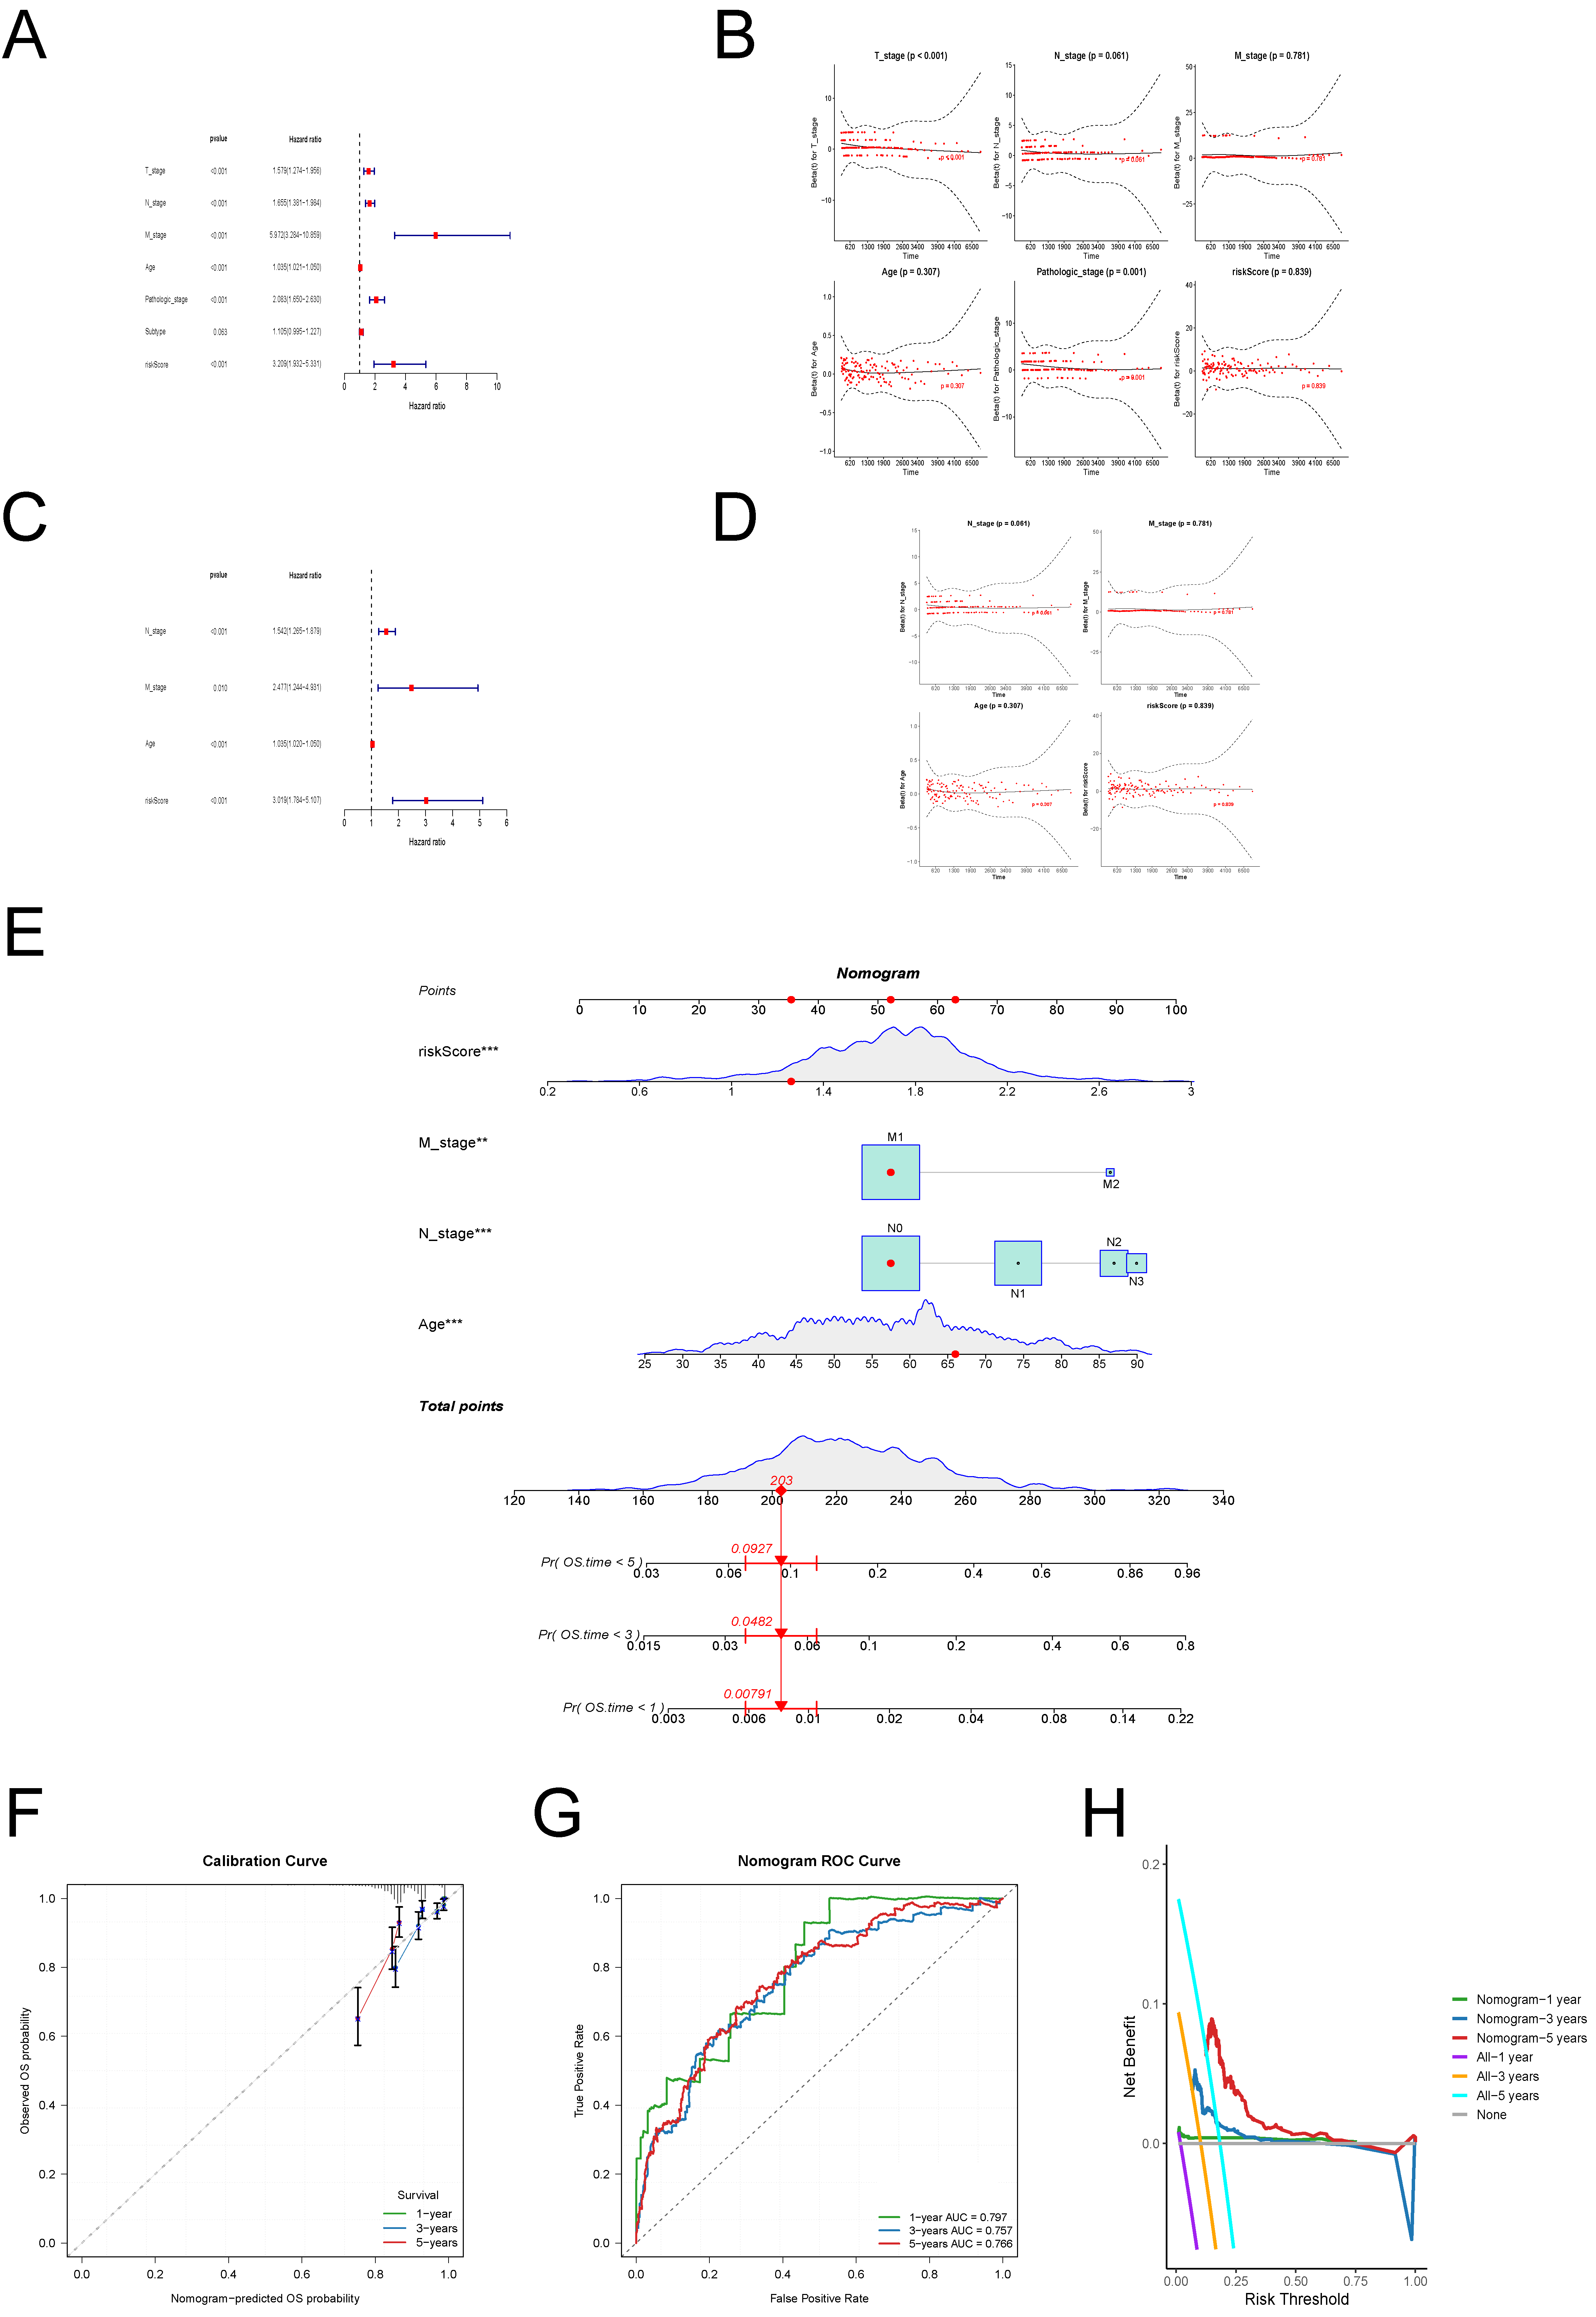
In summary, the Nomogram model exhibited robust performance in both short-term and long-term survival prediction, providing a valuable tool for individualized prognostic assessment in breast cancer patients.
Molecular Pathway Signatures in Different Risk Groups
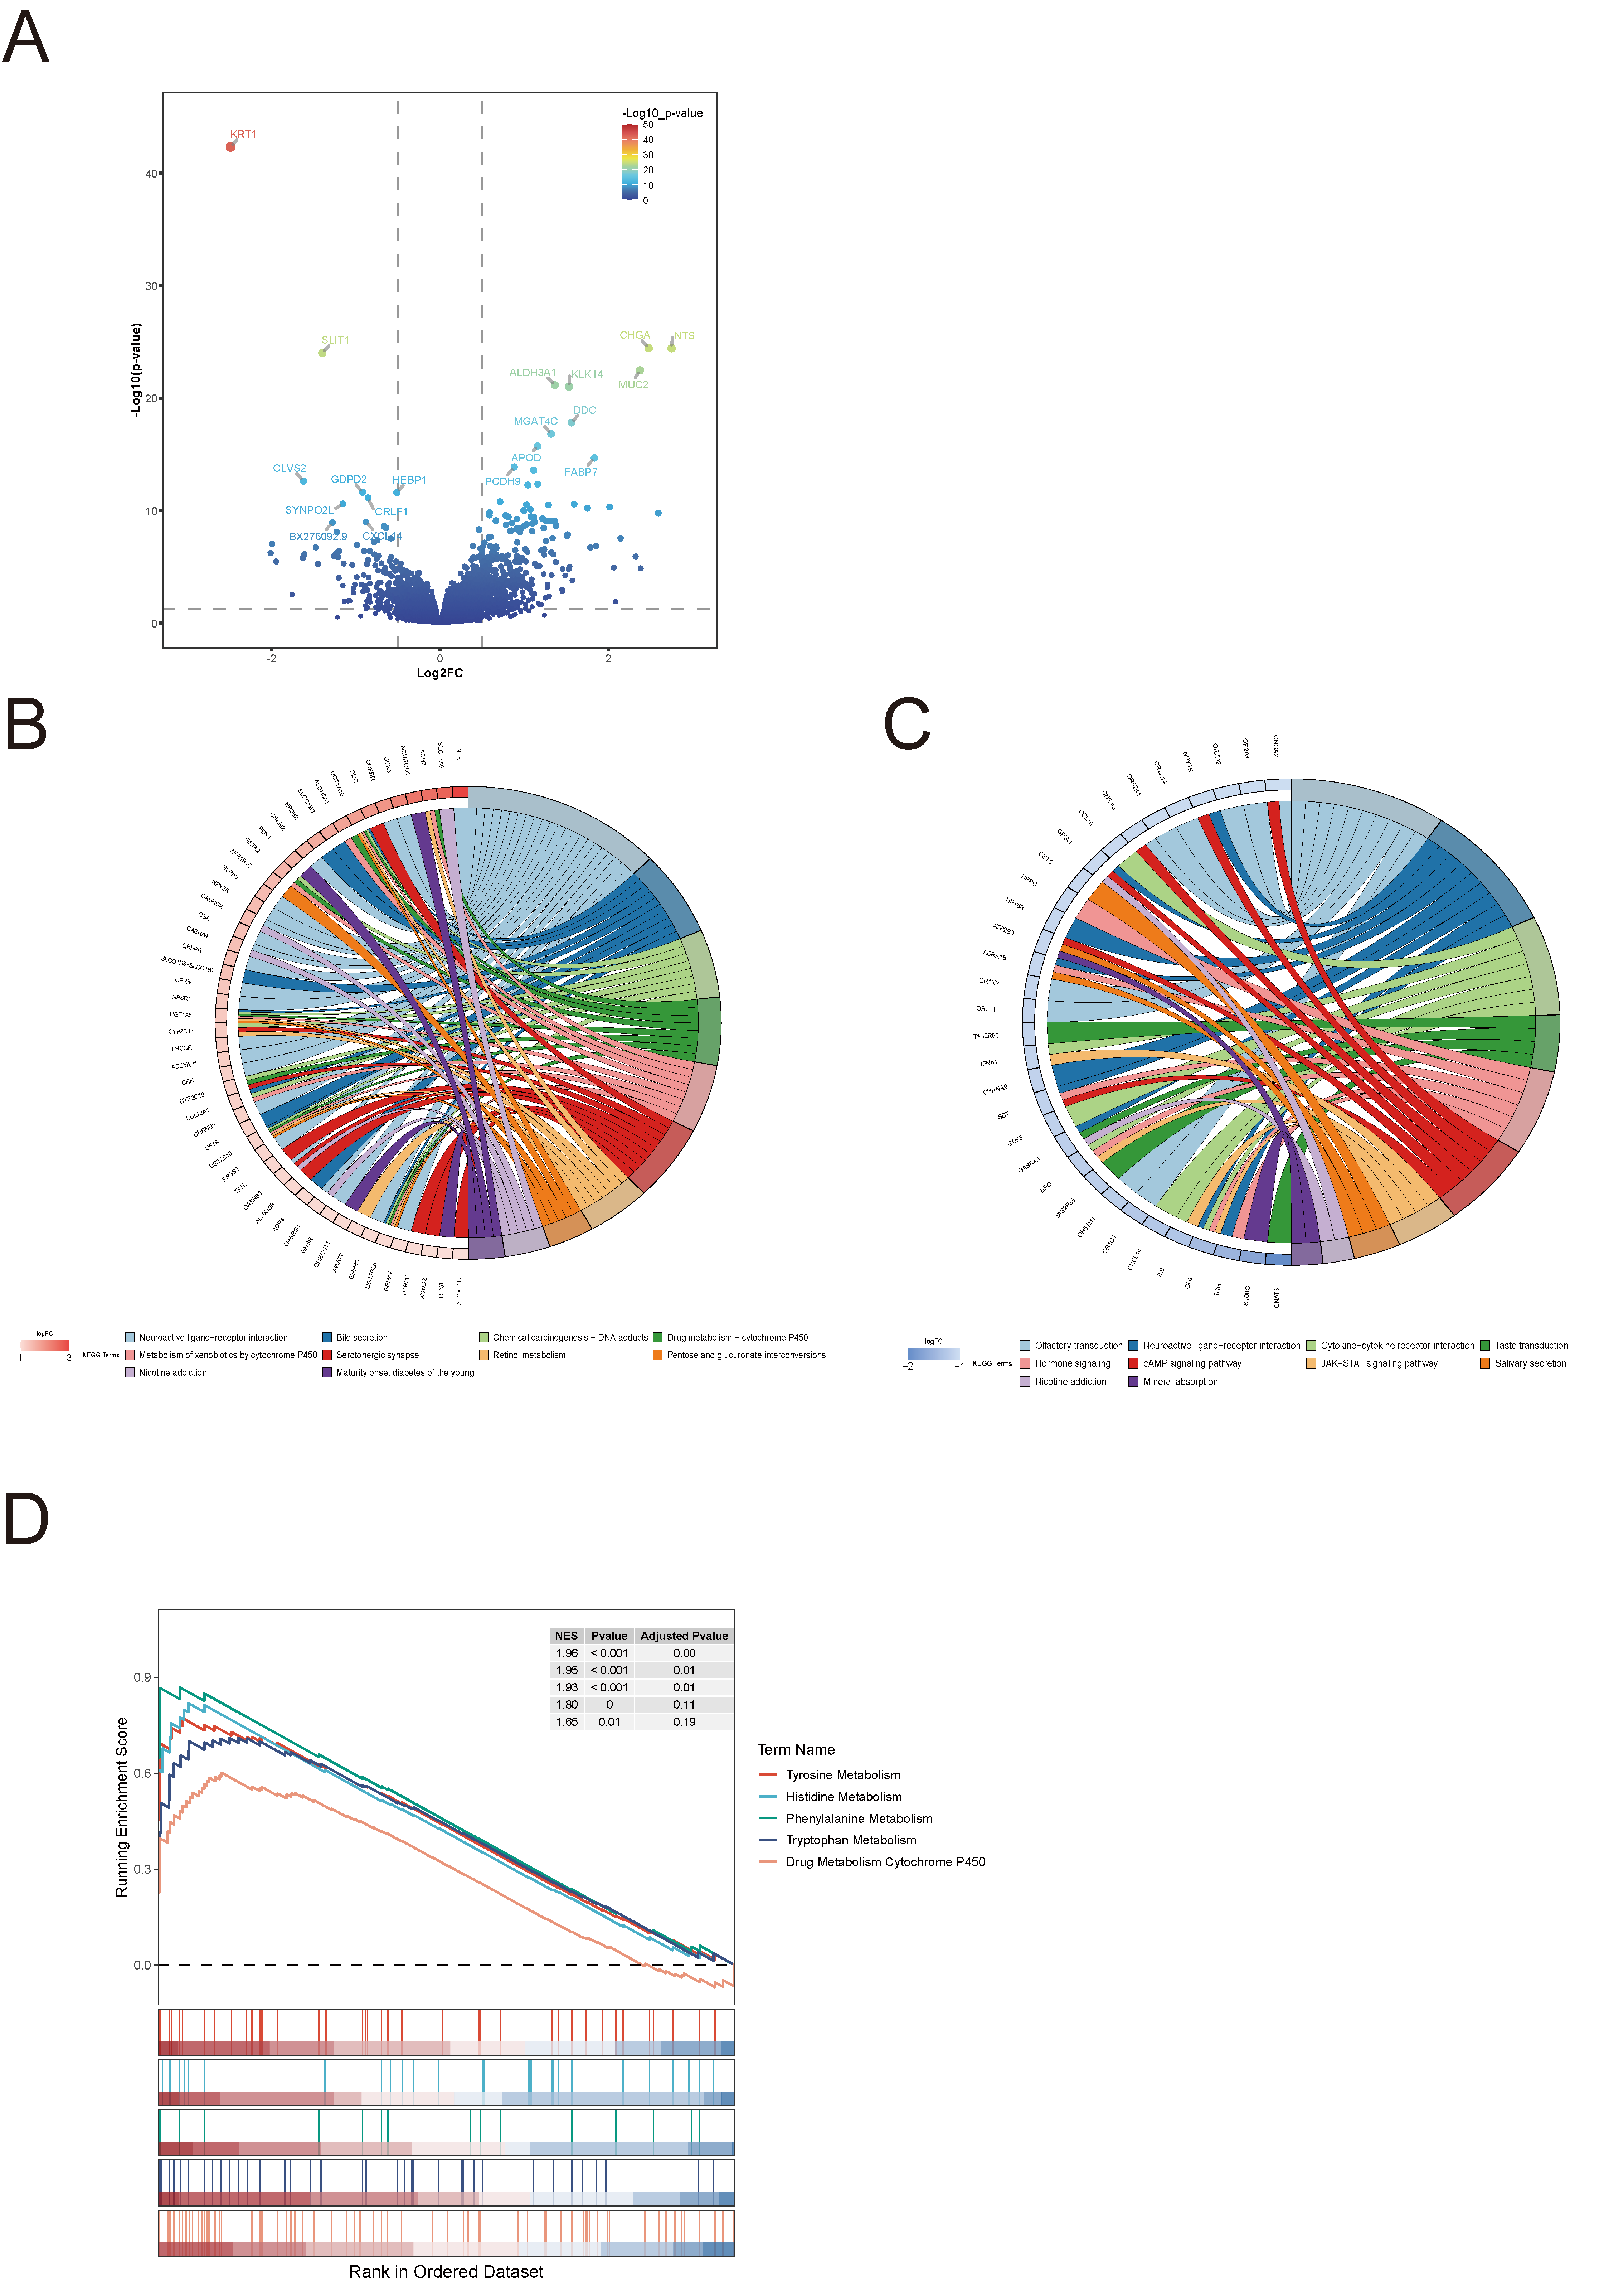
To explore molecular differences between risk groups, differential expression and pathway enrichment analyses were performed. A total of 407 genes were significantly upregulated and 133 downregulated in the high-risk group. The top 20 differentially expressed genes were visualized in a volcano plot (Figure 7A).
KEGG pathway enrichment analysis revealed that upregulated genes in the high-risk group were primarily involved in neuroactive ligand–receptor interaction, bile secretion, and cytochrome P450–mediated drug metabolism (Figure 7B). In contrast, downregulated genes were enriched in neuroactive ligand–receptor interaction and cytokine–cytokine receptor interaction pathways (Figure 7C).
GSEA further showed significant activation of amino acid metabolism pathways, including tyrosine, histidine, and phenylalanine metabolism, in the high-risk group (Figure 7D). These findings suggest that metabolic pathway reprogramming, particularly involving amino acid metabolism, may contribute to the aggressive phenotype and poorer prognosis observed in high-risk breast cancer patients.
Figure 7. Molecular Pathway Signatures in Different Risk Groups.(A) Volcano plot showing differentially expressed genes between high-risk and low-risk groups, with the top 20 most significant genes highlighted.(B) KEGG pathway enrichment analysis of upregulated genes in the high-risk group.(C) KEGG pathway enrichment analysis of downregulated genes in the high-risk group.(D) GSEA showing activated metabolic pathways in the high-risk group.
Association Between Risk Score and Tumor Immune Microenvironment
The relationship between the risk score and tumor immune microenvironment was analyzed. Immune cell infiltration was quantified using the CIBERSORT, revealing the proportions of 22 immune cell types (Figure 8A). Comparative analysis (Figure 8B) showed that resting dendritic cells and M1 macrophages were significantly more abundant in the low-risk group (p < 0.05).
Immune cell interaction analysis (Figure 8C) revealed a strong positive correlation between activated CD8⁺ T cells and CD4⁺ memory activated T cells (r = 0.439, p < 0.001), while M0 macrophages exhibited significant negative correlations with CD4⁺ memory resting T cells (r = −0.404) and CD8⁺ T cells (r = −0.368), suggesting a dynamic balance between pro- and anti-tumor immune components.
Figure 8. Association Between Risk Score and Tumor Immune Microenvironment(A) Stacked bar chart showing the proportions of 22 immune cell subpopulations across risk groups based on CIBERSORT analysis.(B) Box plots showing differential immune cell infiltration between high-risk and low-risk groups.(C) Correlation heatmap depicting interactions between immune cell populations in the tumor microenvironment.(D) Correlation analysis between the three prognostic marker genes (SDC1, PDLIM4, EMP1) and immune cell populations.
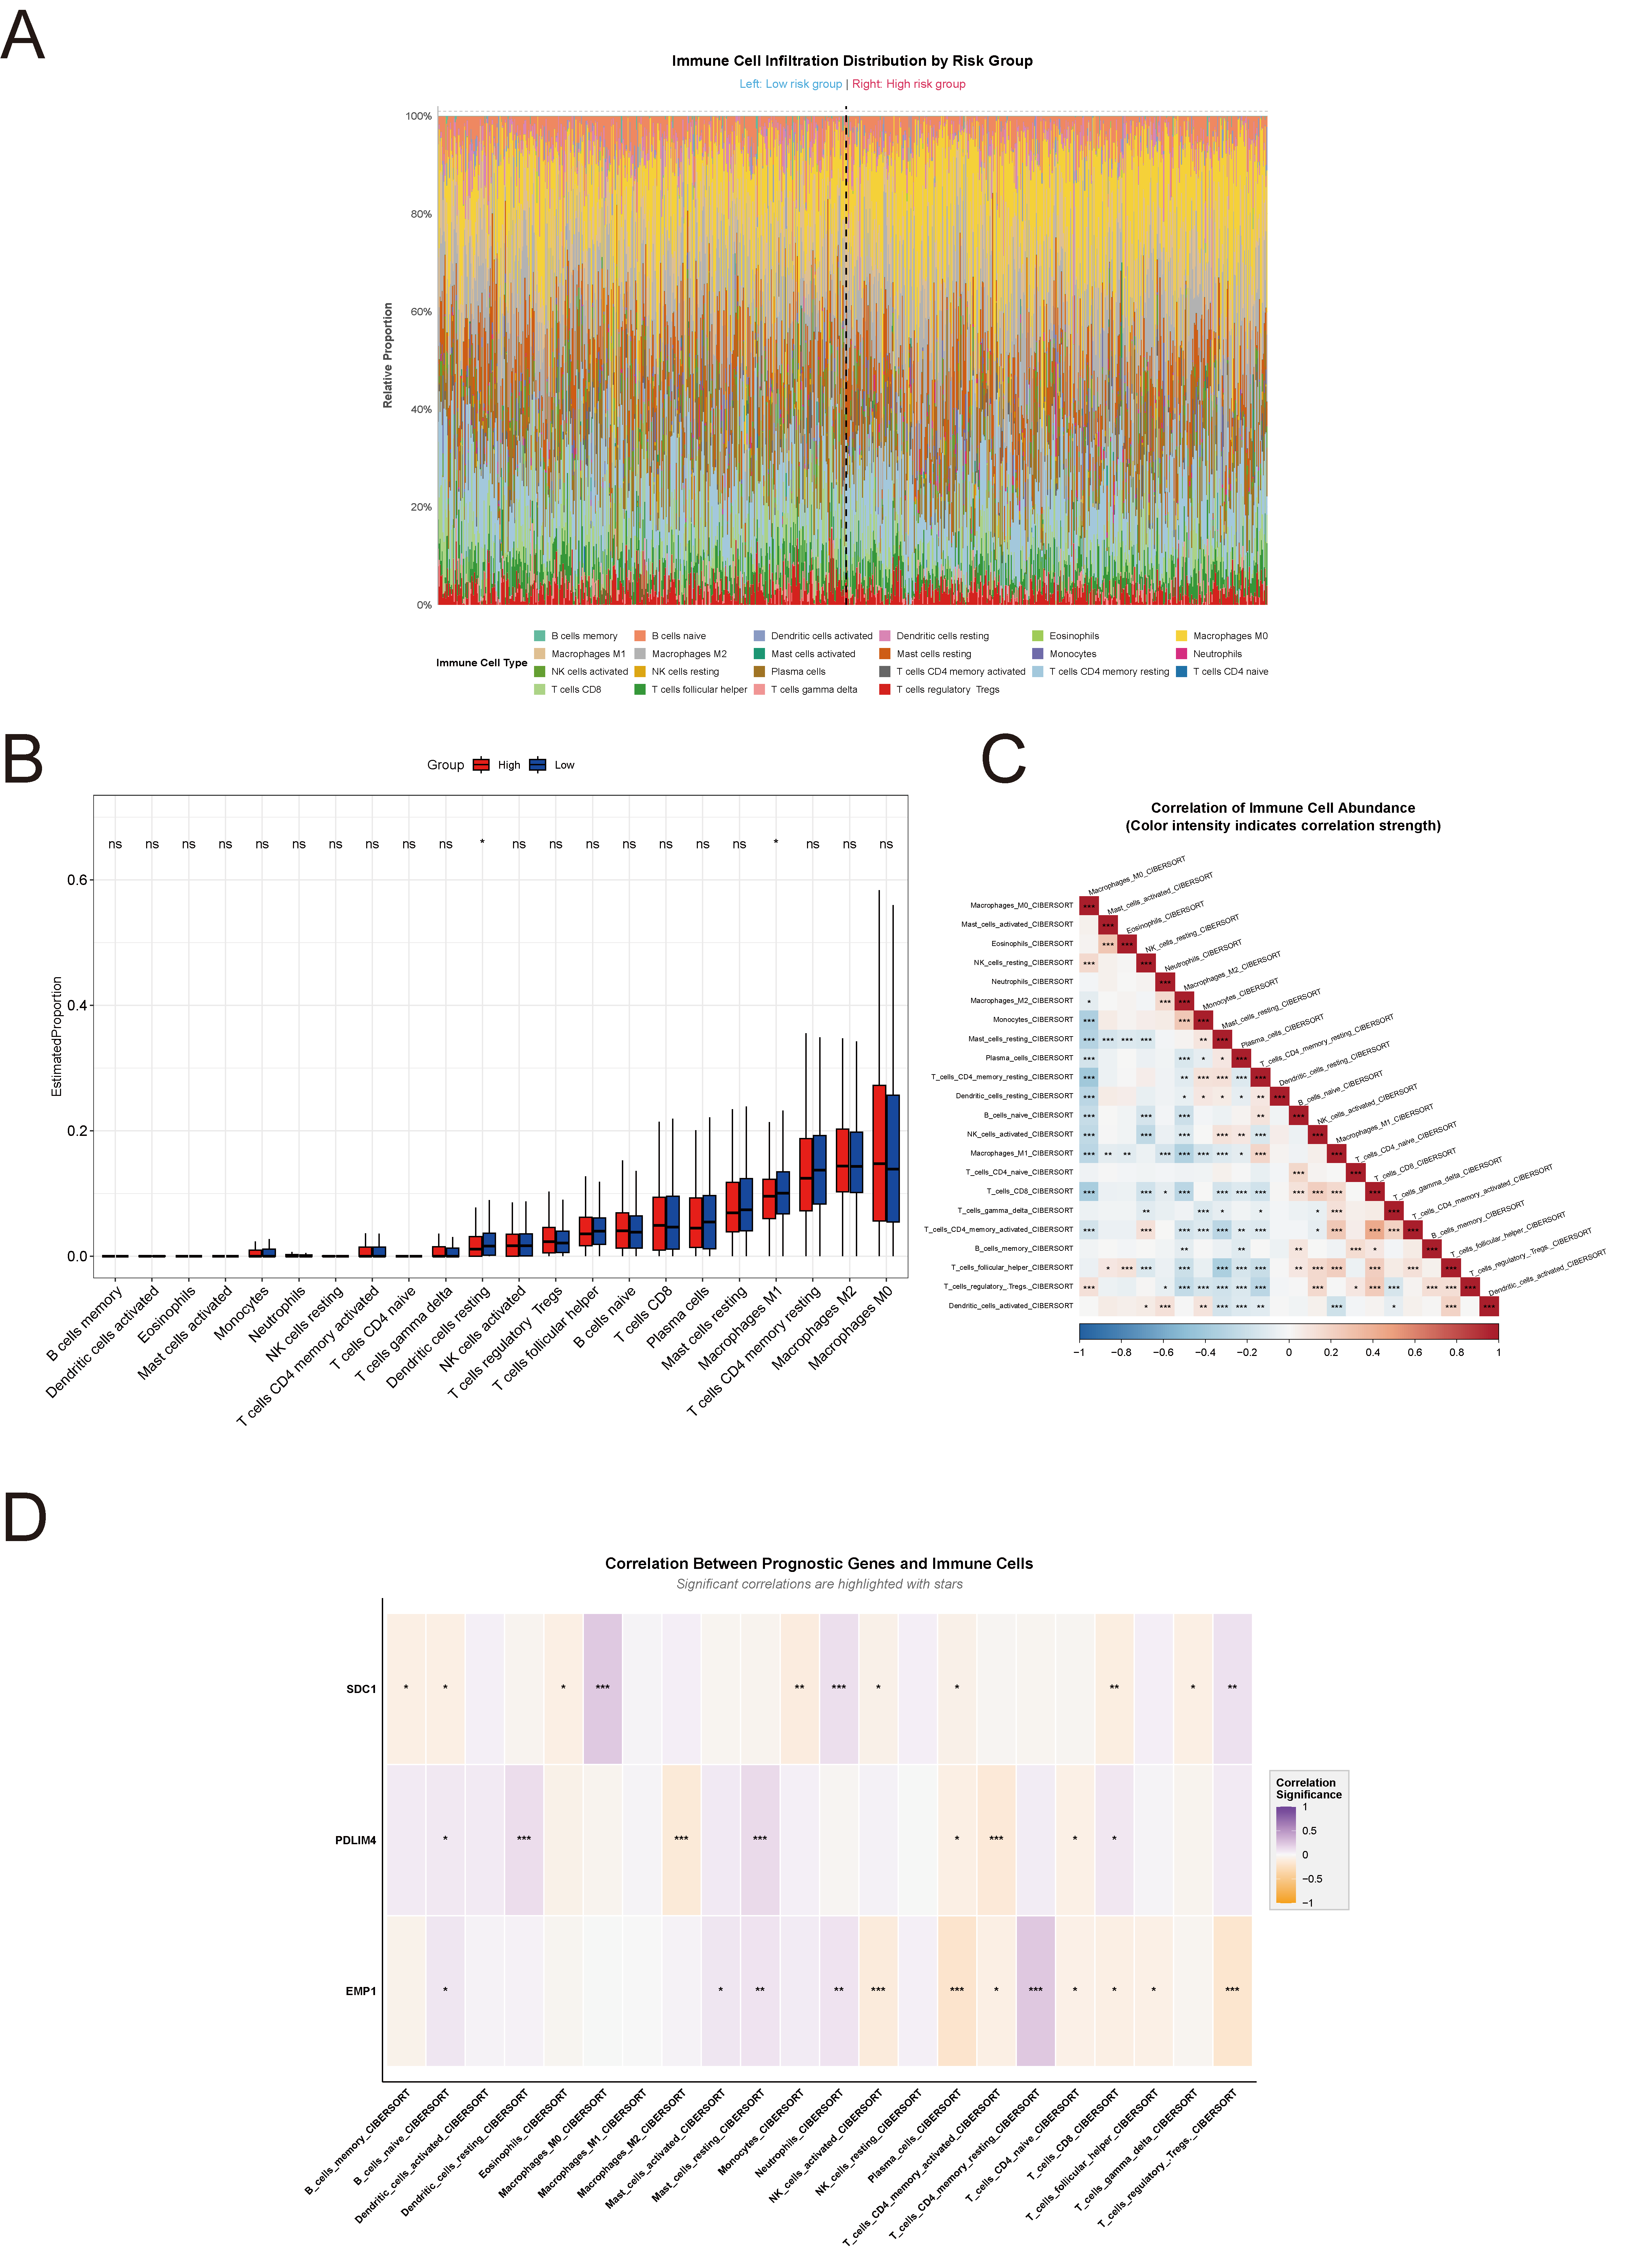
Correlation analysis between prognostic genes and immune cell types (Figure 8D) showed that SDC1 was positively correlated with M0 macrophages and neutrophils; PDLIM4 was negatively correlated with CD4⁺ memory activated T cells and M2 macrophages; and EMP1 was positively correlated with CD4⁺ memory resting T cells but negatively correlated with regulatory T cells. Although statistically significant, the correlation coefficients were all below 0.3, indicating modest but potentially biologically relevant immune associations of the prognostic genes.
Protein Expression Validation and Functional Network Analysis
Immunohistochemistry data from the Human Protein Atlas (HPA) were used to evaluate the protein-level expression of prognostic genes in breast cancer. As shown in Figure 9A, PDLIM4 exhibited higher expression in tumor tissues compared to normal tissues, whereas SDC1 showed a notable downregulation. No immunohistochemical data were available for EMP1 in the HPA database.
A functional interaction network was constructed using GeneMANIA (Figure 9B), revealing that the three prognostic genes were functionally connected with proteins involved in cell adhesion (e.g., SDCBP, CD9), immune regulation (e.g., ANXA1, CXCL2), and signal transduction (e.g., TRIP6, NQO1). These interactions were supported by multiple mechanisms, including physical binding, co-expression, and pathway co-occurrence. This network suggests potential roles for the prognostic genes in breast cancer progression through diverse molecular pathways.
Figure 9. Protein Expression Validation and Functional Network Analysis.(A) Immunohistochemical staining images from the Human Protein Atlas (HPA) database showing differential expression of PDLIM4 and SDC1 proteins between breast cancer and normal breast tissues.(B) Functional interaction network constructed using GeneMANIA showing the relationships between the three prognostic genes (SDC1, PDLIM4, EMP1) and their interacting partners, with different connection types indicated.
Discussion
Chemotherapy resistance remains a major obstacle in the effective management of breast cancer, particularly in aggressive subtypes such as triple-negative breast cancer (TNBC)[16] . This resistance is driven by multifactorial mechanisms, including genomic instability, epigenetic alterations, metabolic reprogramming, and changes in the tumor microenvironment [17] . Immune-related signaling pathways have also been implicated in chemoresistance, with previous studies highlighting the roles of genes such as PRC1, GGTLC1, and IRS1[18] . Moreover, chemoresistance has been associated with shortened patient survival and remodeling of the immune landscape, which together contribute to reduced treatment efficacy [19] . Given these challenges, elucidating the molecular mechanisms underlying 5-FU resistance and identifying robust predictive biomarkers are critical for advancing precision medicine in breast cancer.
Recent studies have highlighted lipid metabolism reprogramming as a key contributor to chemotherapy resistance. Breast cancer cells exhibit unique lipid metabolic profiles influenced by their tissue microenvironment and endocrine signaling [20] . For instance, estrogen receptor–positive breast cancer promotes fatty acid synthesis to modulate membrane fluidity [21] , whereas triple-negative breast cancer relies on lipophagy and lipid droplet dynamics to maintain energy homeostasis under stress [7] . These distinct metabolic adaptations underscore the pivotal role of lipid metabolism in shaping chemotherapeutic responses and influencing patient prognosis.
In this study, a lipid metabolism–related prognostic model for 5-FU resistance in breast cancer was developed by integrating single-cell transcriptomic and bulk multi-omics data. A total of 42 candidate genes associated with both 5-FU resistance and lipid metabolism were identified through differential expression analysis combined with the Scissor algorithm and TCGA-BRCA dataset. Based on Cox regression analysis, a three-gene risk signature comprising PDLIM4, SDC1, and EMP1 was constructed and validated in independent cohorts. The risk score model effectively stratified patients by prognosis, with high-risk patients exhibiting significantly shorter overall survival. Importantly, the risk score remained an independent prognostic factor after adjustment for clinicopathological variables. A nomogram incorporating the risk score and clinical features was also established, demonstrating good predictive performance and clinical applicability. This integrative approach provides a novel framework for predicting chemoresistance and offers a potentially valuable tool for individualized treatment decision-making in breast cancer.
The three genes identified in our risk model—PDLIM4, SDC1, and EMP1—have all been previously implicated in tumor progression and therapy resistance.
PDLIM4, a member of the PDZ and LIM domain protein family, regulates cytoskeletal organization and signal transduction[22] . Its aberrant methylation has been associated with drug resistance in multiple malignancies. In chronic myeloid leukemia, hypermethylation of PDLIM4 correlates with imatinib resistance and disease progression[23] .In prostate cancer, it has been reported as a prognostic marker linked to aberrant promoter methylation [24] . In breast cancer, PDLIM4 overexpression enhances migratory and metastatic capacity, potentially acting as an oncogene independent of Src signaling [25] . These findings align with our results, where PDLIM4 was upregulated in high-risk patients and associated with poor prognosis.
SDC1 encodes a transmembrane heparan sulfate proteoglycan involved in cell proliferation, adhesion, migration, and angiogenesis [26] . Immunohistochemical data from the Human Protein Atlas confirmed reduced SDC1 expression in breast cancer tissues in our study. Interestingly, SDC1 exhibits context-dependent functions: in ER-positive breast cancer, it promotes cell migration and correlates with poor prognosis [27] ; in pancreatic cancer, it facilitates epithelial–mesenchymal transition (EMT) and tumor progression[28] . In contrast, SDC1 downregulation has been observed in gastric[29] and colorectal cancers[30] , suggesting tumor-type specific roles. Our data support a tumor-suppressive role of SDC1 in breast cancer, consistent with its lower expression in the high-risk group.
EMP1 encodes an epithelial membrane protein associated with inflammation and epithelial pathologies[31] . It has been shown to promote triple-negative breast cancer progression by enhancing IL-6 secretion via NF-κB signaling, which stimulates tumor-associated fibroblast proliferation and metastatic spread[32] . The inclusion of EMP1 in our prognostic model and its correlation with poor survival underscore its potential as a therapeutic target in aggressive breast cancer subtypes.
Pathway enrichment analysis revealed that high-risk patients exhibited activation of bile secretion and cytochrome P450–mediated drug metabolism pathways, both of which are involved in lipid processing and drug detoxification [33,34] . These findings are consistent with previous studies suggesting that altered lipid metabolism contributes to chemoresistance through enhanced metabolic flexibility and reduced drug efficacy[35] . Additionally, enrichment of amino acid metabolism pathways in the high-risk group indicates that metabolic reprogramming may provide survival advantages to tumor cells under chemotherapeutic stress, further reinforcing the role of metabolic adaptation in treatment resistance.
Our analysis revealed significant associations between the risk score and components of the tumor immune microenvironment. CIBERSORT analysis demonstrated that resting dendritic cells and M1 macrophages were significantly enriched in the low-risk group. Dendritic cells play a key role in antigen presentation and activation of immune effector cells, thereby contributing to tumor immune surveillance [36] . However, their function is often suppressed within the tumor microenvironment, a state that can be reversed through immune-stimulatory interventions such as CpG oligodeoxynucleotide treatment[37] . M1 macrophages support anti-tumor immunity by promoting Th1-type responses and secreting pro-inflammatory cytokines such as IL-12 and TNF-α[38] . Their enrichment in the low-risk group may indicate a more active immune surveillance environment, which could contribute to the improved prognosis observed in these patients.
Although the correlations between prognostic gene expression and immune cell infiltration were modest, they were statistically significant. These findings suggest that the identified genes may influence the tumor immune landscape through complex regulatory networks involving cytokine signaling, cell adhesion, and metabolic pathways. Further investigations using single-cell sequencing and spatial transcriptomics are warranted to delineate these interactions and guide the development of precise immunotherapeutic strategies.
This study has several limitations that should be acknowledged. First, it is a retrospective analysis based on publicly available datasets, which may introduce selection bias and limit the generalizability of the findings to broader patient populations. The heterogeneity in sequencing platforms, sample processing protocols, and clinical annotations across datasets could influence the robustness of the integrated analysis. Second, the predictive model has not yet been validated in prospective clinical trials. Experimental validation is essential to confirm the biological roles of the three identified prognostic genes—PDLIM4, SDC1, and EMP1—in mediating 5-FU resistance and lipid metabolism. Future studies should incorporate in vitro and in vivo assays to elucidate the functional relevance of these genes. Third, the immune microenvironment analysis in this study was primarily based on computational inference using CIBERSORT. While useful, such approaches rely on transcriptomic data and may not fully capture spatial or functional heterogeneity. Experimental validation, such as immunohistochemistry, multiplex immunofluorescence, or spatial transcriptomics, is needed to corroborate these findings. Lastly, the prognostic model was developed based on overall survival as the sole clinical endpoint. Future research should evaluate additional endpoints such as progression-free survival, treatment response, and recurrence risk, and test the model's predictive power across different breast cancer subtypes and treatment regimens.Together, these limitations highlight the need for prospective, multi-dimensional validation to ensure the clinical applicability and translational potential of the proposed risk model.
Conclusion
This study highlights the critical role of lipid metabolism in breast cancer resistance to 5-FU. We constructed a prognostic model based on PDLIM4, SDC1, and EMP1, which effectively stratified patient outcomes and demonstrated independent prognostic value. These findings offer a clinically relevant tool for personalized treatment and suggest that targeting lipid metabolism may enhance therapeutic efficacy in resistant breast cancer.
Supplementary Material
Supplementary methods, results, spectra, figures.
Acknowledgements
The authors are grateful for the valuable contribution of the TCGA and GEO project.
Author contributions
Zhihao Wei, Bin Ye and Zezhong Zhang conceptualized and designed the study, performed the majority of the bioinformatic analyses and data interpretation, and drafted the manuscript. Zhuojun Luo conducted investigation procedures and managed data curation. Jie Zhou supervised the project, provided resources, administered project execution, and critically reviewed and edited the manuscript. All authors read and approved the final manuscript.
Funding information
This work was supported by Guangzhou Science and Technology Project(2024A03J0649).
Competing Interests
The authors declare that they have no existing or potential commercial or financial relationships that could create a conflict of interest at the time of conducting this study.
Data Availability
All data needed to evaluate the conclusions in the paper are present in the paper or the Supplementary Materials. Additional data related to this paper may be requested from the authors.
References
[1]Bray F, Laversanne M, Sung H, Ferlay J, Siegel RL, Soerjomataram I, et al. Global cancer statistics 2022: GLOBOCAN estimates of incidence and mortality worldwide for 36 cancers in 185 countries. CA Cancer J Clin 2024;74:229–63. https://doi.org/10.3322/caac.21834.
[2]Han B, Zheng R, Zeng H, Wang S, Sun K, Chen R, et al. Cancer incidence and mortality in China, 2022. J Natl Cancer Cent 2024;4:47–53. https://doi.org/10.1016/j.jncc.2024.01.006.
[3]Guo R, Si J, Xue J, Su Y, Mo M, Yang B, et al. Changing patterns and survival improvements of young breast cancer in China and SEER database, 1999-2017. Chin J Cancer Res Chung-Kuo Yen Cheng Yen Chiu 2019;31:653–62. https://doi.org/10.21147/j.issn.1000-9604.2019.04.09.
[4]Sathiakumar N, Delzell E, Morrisey MA, Falkson C, Yong M, Chia V, et al. Mortality following bone metastasis and skeletal-related events among women with breast cancer: a population-based analysis of U.S. Medicare beneficiaries, 1999-2006. Breast Cancer Res Treat 2012;131:231–8. https://doi.org/10.1007/s10549-011-1721-x.
[5]Longley DB, Harkin DP, Johnston PG. 5-fluorouracil: mechanisms of action and clinical strategies. Nat Rev Cancer 2003;3:330–8. https://doi.org/10.1038/nrc1074.
[6]Bukowski K, Kciuk M, Kontek R. Mechanisms of Multidrug Resistance in Cancer Chemotherapy. Int J Mol Sci 2020;21:3233. https://doi.org/10.3390/ijms21093233.
[7]Wong A, Chen S, Yang LK, Kanagasundaram Y, Crasta K. Lipid accumulation facilitates mitotic slippage-induced adaptation to anti-mitotic drug treatment. Cell Death Discov 2018;4:109. https://doi.org/10.1038/s41420-018-0127-5.
[8]Jung JH, Taniguchi K, Lee HM, Lee MY, Bandu R, Komura K, et al. Comparative lipidomics of 5-Fluorouracil-sensitive and -resistant colorectal cancer cells reveals altered sphingomyelin and ceramide controlled by acid sphingomyelinase (SMPD1). Sci Rep 2020;10:6124. https://doi.org/10.1038/s41598-020-62823-0.
[9]Fu Y, Yang G, Zhu F, Peng C, Li W, Li H, et al. Antioxidants decrease the apoptotic effect of 5-Fu in colon cancer by regulating Src-dependent caspase-7 phosphorylation. Cell Death Dis 2014;5:e983. https://doi.org/10.1038/cddis.2013.509.
[10]Barrett T, Wilhite SE, Ledoux P, Evangelista C, Kim IF, Tomashevsky M, et al. NCBI GEO: archive for functional genomics data sets--update. Nucleic Acids Res 2013;41:D991-995. https://doi.org/10.1093/nar/gks1193.
[11]Stelzer G, Rosen N, Plaschkes I, Zimmerman S, Twik M, Fishilevich S, et al. The GeneCards Suite: From Gene Data Mining to Disease Genome Sequence Analyses. Curr Protoc Bioinforma 2016;54:1.30.1-1.30.33. https://doi.org/10.1002/cpbi.5.
[12]Sun D, Guan X, Moran AE, Wu L-Y, Qian DZ, Schedin P, et al. Identifying phenotype-associated subpopulations by integrating bulk and single-cell sequencing data. Nat Biotechnol 2022;40:527–38. https://doi.org/10.1038/s41587-021-01091-3.
[13]Szklarczyk D, Kirsch R, Koutrouli M, Nastou K, Mehryary F, Hachilif R, et al. The STRING database in 2023: protein-protein association networks and functional enrichment analyses for any sequenced genome of interest. Nucleic Acids Res 2023;51:D638–46. https://doi.org/10.1093/nar/gkac1000.
[14]Zeng D, Ye Z, Shen R, Yu G, Wu J, Xiong Y, et al. IOBR: Multi-Omics Immuno-Oncology Biological Research to Decode Tumor Microenvironment and Signatures. Front Immunol 2021;12:687975. https://doi.org/10.3389/fimmu.2021.687975.
[15]Mostafavi S, Ray D, Warde-Farley D, Grouios C, Morris Q. GeneMANIA: a real-time multiple association network integration algorithm for predicting gene function. Genome Biol 2008;9 Suppl 1:S4. https://doi.org/10.1186/gb-2008-9-s1-s4.
[16]Huang P, Ouyang D-J, Chang S, Li M-Y, Li L, Li Q-Y, et al. Chemotherapy-driven increases in the CDKN1A/PTN/PTPRZ1 axis promote chemoresistance by activating the NF-κB pathway in breast cancer cells. Cell Commun Signal CCS 2018;16:92. https://doi.org/10.1186/s12964-018-0304-4.
[17]Saha Detroja T, Detroja R, Mukherjee S, Samson AO. Identifying Hub Genes Associated with Neoadjuvant Chemotherapy Resistance in Breast Cancer and Potential Drug Repurposing for the Development of Precision Medicine. Int J Mol Sci 2022;23:12628. https://doi.org/10.3390/ijms232012628.
[18]Du Y, Han Y, Wang X, Wang H, Qu Y, Guo K, et al. Identification of Immune-Related Breast Cancer Chemotherapy Resistance Genes via Bioinformatics Approaches. Front Oncol 2022;12:772723. https://doi.org/10.3389/fonc.2022.772723.
[19]Liutkauskiene S, Grizas S, Jureniene K, Suipyte J, Statnickaite A, Juozaityte E. Retrospective analysis of the impact of anthracycline dose reduction and chemotherapy delays on the outcomes of early breast cancer molecular subtypes. BMC Cancer 2018;18:453. https://doi.org/10.1186/s12885-018-4365-y.
[20]Matsushita Y, Nakagawa H, Koike K. Lipid Metabolism in Oncology: Why It Matters, How to Research, and How to Treat. Cancers 2021;13:474. https://doi.org/10.3390/cancers13030474.
[21]Peetla C, Bhave R, Vijayaraghavalu S, Stine A, Kooijman E, Labhasetwar V. Drug resistance in breast cancer cells: biophysical characterization of and doxorubicin interactions with membrane lipids. Mol Pharm 2010;7:2334–48. https://doi.org/10.1021/mp100308n.
[22]Kravchenko DS, Frolova EI, Kravchenko JE, Chumakov SP. [Role of PDLIM4 and c-Src in Breast Cancer Progression]. Mol Biol (Mosk) 2016;50:69–79. https://doi.org/10.7868/S0026898416010092.
[23]Jelinek J, Gharibyan V, Estecio MRH, Kondo K, He R, Chung W, et al. Aberrant DNA methylation is associated with disease progression, resistance to imatinib and shortened survival in chronic myelogenous leukemia. PloS One 2011;6:e22110. https://doi.org/10.1371/journal.pone.0022110.
[24]He M, Vanaja DK, Karnes RJ, Young CYF. Epigenetic regulation of Myc on retinoic acid receptor beta and PDLIM4 in RWPE1 cells. The Prostate 2009;69:1643–50. https://doi.org/10.1002/pros.21013.
[25]Kravchenko DS, Ivanova AE, Podshivalova ES, Chumakov SP. PDLIM4/RIL-mediated regulation of Src and malignant properties of breast cancer cells. Oncotarget 2020;11:22–30. https://doi.org/10.18632/oncotarget.27410.
[26]Liao S, Liu C, Zhu G, Wang K, Yang Y, Wang C. Relationship between SDC1 and cadherin signalling activation in cancer. Pathol Res Pract 2020;216:152756. https://doi.org/10.1016/j.prp.2019.152756.
[27]Nikolova V, Koo C-Y, Ibrahim SA, Wang Z, Spillmann D, Dreier R, et al. Differential roles for membrane-bound and soluble syndecan-1 (CD138) in breast cancer progression. Carcinogenesis 2009;30:397–407. https://doi.org/10.1093/carcin/bgp001.
[28]Yang Y, Tao X, Li C-B, Wang C-M. MicroRNA-494 acts as a tumor suppressor in pancreatic cancer, inhibiting epithelial-mesenchymal transition, migration and invasion by binding to SDC1. Int J Oncol 2018;53:1204–14. https://doi.org/10.3892/ijo.2018.4445.
[29]Tang W, Morgan DR, Meyers MO, Dominguez RL, Martinez E, Kakudo K, et al. Epstein-barr virus infected gastric adenocarcinoma expresses latent and lytic viral transcripts and has a distinct human gene expression profile. Infect Agent Cancer 2012;7:21. https://doi.org/10.1186/1750-9378-7-21.
[30]Pap Z, Pávai Z, Dénes L, Kovalszky I, Jung J. An immunohistochemical study of colon adenomas and carcinomas: E-cadherin, Syndecan-1, Ets-1. Pathol Oncol Res POR 2009;15:579–87. https://doi.org/10.1007/s12253-009-9157-x.
[31]Wang Y-W, Cheng H-L, Ding Y-R, Chou L-H, Chow N-H. EMP1, EMP 2, and EMP3 as novel therapeutic targets in human cancer. Biochim Biophys Acta Rev Cancer 2017;1868:199–211. https://doi.org/10.1016/j.bbcan.2017.04.004.
[32]Wang Q, Li D, Ma H, Li Z, Wu J, Qiao J, et al. Tumor cell-derived EMP1 is essential for cancer-associated fibroblast infiltration in tumor microenvironment of triple-negative breast cancer. Cell Death Dis 2025;16:143. https://doi.org/10.1038/s41419-025-07464-9.
[33]Kumari A, Pal Pathak D, Asthana S. Bile acids mediated potential functional interaction between FXR and FATP5 in the regulation of Lipid Metabolism. Int J Biol Sci 2020;16:2308–22. https://doi.org/10.7150/ijbs.44774.
[34]Zhang J, Gao L-Z, Chen Y-J, Zhu P-P, Yin S-S, Su M-M, et al. Continuum of Host-Gut Microbial Co-metabolism: Host CYP3A4/3A7 are Responsible for Tertiary Oxidations of Deoxycholate Species. Drug Metab Dispos Biol Fate Chem 2019;47:283–94. https://doi.org/10.1124/dmd.118.085670.
[35]Heo J, Eki R, Abbas T. Deregulation of F-box proteins and its consequence on cancer development, progression and metastasis. Semin Cancer Biol 2016;36:33–51. https://doi.org/10.1016/j.semcancer.2015.09.015.
[36]Alli RS, Khar A. Dendritic cells as natural adjuvants and modulators of immune response in cancer immunotherapy. Indian J Biochem Biophys 2002;39:363–7.
[37]Liu J, Li H-J, Luo Y-L, Chen Y-F, Fan Y-N, Du J-Z, et al. Programmable Delivery of Immune Adjuvant to Tumor-Infiltrating Dendritic Cells for Cancer Immunotherapy. Nano Lett 2020;20:4882–9. https://doi.org/10.1021/acs.nanolett.0c00893.
[38]Lu Y, Zhu W, Zhang GX, Chen JC, Wang QL, Mao MY, et al. Adenosine A2A receptor activation regulates the M1 macrophages activation to initiate innate and adaptive immunity in psoriasis. Clin Immunol Orlando Fla 2024;266:110309. https://doi.org/10.1016/j.clim.2024.110309.
 Figures
 References
 Peer
Peer Information
Figure 1. Preliminary single-cell transcriptomic analysis of 5-FU resistance mechanisms in breast cancer(A) Quality control workflow diagram showing 123,901 high-quality cells retained after multi-parameter filtration.(B) UMAP dimensionality reduction plot after multi-sample integration demonstrating batch effect elimination.(C) UMAP visualization of 15 initial cell clusters obtained using optimized clustering parameters (resolution=0.2).(D) UMAP plot of 10 annotated cell subpopulations.(E) Heatmap of cell type-specific marker gene expression.
Figure 2. Identification and characterization of 5-FU resistant cancer cell subpopulations(A) Integration status of samples after cancer cell reclustering.(B) Distribution characteristics of 11 cancer cell subgroups.(C) Correlation assessment between individual cancer cells and 5-FU resistance using the Scissor algorithm.(D) Spatial distribution patterns of 5-FU resistant and sensitive cell clusters.(E) Volcano plot depicting 84 differentially expressed genes significantly associated with 5-FU resistance.
Figure 3. Identification of Candidate Genes Linking 5-FU Resistance to Lipid Metabolism(A) Volcano plot illustrating differential gene expression in the TCGA-BRCA dataset.(B) Heatmap displaying the TOP10 upregulated and TOP10 downregulated genes from the TCGA-BRCA dataset.(C) Venn diagram of intersection analysis between TCGA-BRCA differentially expressed genes, 5-FU resistance-associated genes from single-cell analysis, and Genecard lipid metabolism-related genes.(D) Protein-protein interaction network of the 42 candidate genes constructed using the STRING database(E) TOP10 GO enrichment pathways of the 42 candidate genes.(F) TOP10 KEGG enrichment pathways of the 42 candidate genes
Figure 4. Development and Validation of a Three-Gene Prognostic Model(A) Forest plot of univariate Cox regression analysis identifying prognostic gene markers.(B) Proportional hazards assumption testing results for candidate genes.(C) Forest plot of multivariate Cox regression analysis identifying independent prognostic genes.(D) Proportional hazards assumption verification for the final selected genes.(E) Time-dependent ROC curves for the risk prediction model in the TCGA-BRCA training cohort.(F) Time-dependent ROC curves for the risk prediction model in the GSE103091 validation cohort.(G) Kaplan-Meier survival curves comparing high-risk and low-risk groups in the TCGA-BRCA training cohort.(H) Kaplan-Meier survival curves comparing high-risk and low-risk groups in the GSE103091 validation cohort.
Figure 5. Risk Score Analysis and Model Performance Visualization.(A) Risk score distribution plot for patients in the TCGA-BRCA training cohort.(B) Risk score distribution plot for patients in the GSE103091 validation cohort.(C) Survival status scatter plot for patients in the TCGA-BRCA training cohort.(D) Survival status scatter plot for patients in the GSE103091 validation cohort.(E) Heatmap showing expression patterns of the three key genes in the TCGA-BRCA training cohort.(F) Heatmap showing expression patterns of the three key genes in the GSE103091 validation cohort.(G) Three-dimensional principal component analysis (PCA) of risk groups in the TCGA-BRCA training cohort.(H) Three-dimensional principal component analysis (PCA) of risk groups in the GSE103091 validation cohort.
Figure 6. Development of a Nomogram Model.(A) Forest plot of univariate Cox regression analysis for clinicopathological characteristics and risk score.(B) Proportional hazards assumption testing results for clinical variables.(C) Forest plot of multivariate Cox regression analysis identifying independent prognostic factors.(D) Proportional hazards assumption verification for the final selected variables.(E) Nomogram integrating age, N stage, M stage, and risk score for predicting 1-year, 3-year, and 5-year overall survival.(F) Calibration curves for the Nomogram model at 1-year, 3-year, and 5-year time points.(G) Time-dependent ROC curves for the Nomogram model showing discriminative ability.(H) Decision curve analysis demonstrating the clinical utility of the Nomogram model.
Figure 7. Molecular Pathway Signatures in Different Risk Groups.(A) Volcano plot showing differentially expressed genes between high-risk and low-risk groups, with the top 20 most significant genes highlighted.(B) KEGG pathway enrichment analysis of upregulated genes in the high-risk group.(C) KEGG pathway enrichment analysis of downregulated genes in the high-risk group.(D) GSEA showing activated metabolic pathways in the high-risk group.
Figure 8. Association Between Risk Score and Tumor Immune Microenvironment(A) Stacked bar chart showing the proportions of 22 immune cell subpopulations across risk groups based on CIBERSORT analysis.(B) Box plots showing differential immune cell infiltration between high-risk and low-risk groups.(C) Correlation heatmap depicting interactions between immune cell populations in the tumor microenvironment.(D) Correlation analysis between the three prognostic marker genes (SDC1, PDLIM4, EMP1) and immune cell populations.
Figure 9. Protein Expression Validation and Functional Network Analysis.(A) Immunohistochemical staining images from the Human Protein Atlas (HPA) database showing differential expression of PDLIM4 and SDC1 proteins between breast cancer and normal breast tissues.(B) Functional interaction network constructed using GeneMANIA showing the relationships between the three prognostic genes (SDC1, PDLIM4, EMP1) and their interacting partners, with different connection types indicated.
[1]Bray F, Laversanne M, Sung H, Ferlay J, Siegel RL, Soerjomataram I, et al. Global cancer statistics 2022: GLOBOCAN estimates of incidence and mortality worldwide for 36 cancers in 185 countries. CA Cancer J Clin 2024;74:229–63. https://doi.org/10.3322/caac.21834.
[2]Han B, Zheng R, Zeng H, Wang S, Sun K, Chen R, et al. Cancer incidence and mortality in China, 2022. J Natl Cancer Cent 2024;4:47–53. https://doi.org/10.1016/j.jncc.2024.01.006.
[3]Guo R, Si J, Xue J, Su Y, Mo M, Yang B, et al. Changing patterns and survival improvements of young breast cancer in China and SEER database, 1999-2017. Chin J Cancer Res Chung-Kuo Yen Cheng Yen Chiu 2019;31:653–62. https://doi.org/10.21147/j.issn.1000-9604.2019.04.09.
[4]Sathiakumar N, Delzell E, Morrisey MA, Falkson C, Yong M, Chia V, et al. Mortality following bone metastasis and skeletal-related events among women with breast cancer: a population-based analysis of U.S. Medicare beneficiaries, 1999-2006. Breast Cancer Res Treat 2012;131:231–8. https://doi.org/10.1007/s10549-011-1721-x.
[5]Longley DB, Harkin DP, Johnston PG. 5-fluorouracil: mechanisms of action and clinical strategies. Nat Rev Cancer 2003;3:330–8. https://doi.org/10.1038/nrc1074.
[6]Bukowski K, Kciuk M, Kontek R. Mechanisms of Multidrug Resistance in Cancer Chemotherapy. Int J Mol Sci 2020;21:3233. https://doi.org/10.3390/ijms21093233.
[7]Wong A, Chen S, Yang LK, Kanagasundaram Y, Crasta K. Lipid accumulation facilitates mitotic slippage-induced adaptation to anti-mitotic drug treatment. Cell Death Discov 2018;4:109. https://doi.org/10.1038/s41420-018-0127-5.
[8]Jung JH, Taniguchi K, Lee HM, Lee MY, Bandu R, Komura K, et al. Comparative lipidomics of 5-Fluorouracil-sensitive and -resistant colorectal cancer cells reveals altered sphingomyelin and ceramide controlled by acid sphingomyelinase (SMPD1). Sci Rep 2020;10:6124. https://doi.org/10.1038/s41598-020-62823-0.
[9]Fu Y, Yang G, Zhu F, Peng C, Li W, Li H, et al. Antioxidants decrease the apoptotic effect of 5-Fu in colon cancer by regulating Src-dependent caspase-7 phosphorylation. Cell Death Dis 2014;5:e983. https://doi.org/10.1038/cddis.2013.509.
[10]Barrett T, Wilhite SE, Ledoux P, Evangelista C, Kim IF, Tomashevsky M, et al. NCBI GEO: archive for functional genomics data sets--update. Nucleic Acids Res 2013;41:D991-995. https://doi.org/10.1093/nar/gks1193.
[11]Stelzer G, Rosen N, Plaschkes I, Zimmerman S, Twik M, Fishilevich S, et al. The GeneCards Suite: From Gene Data Mining to Disease Genome Sequence Analyses. Curr Protoc Bioinforma 2016;54:1.30.1-1.30.33. https://doi.org/10.1002/cpbi.5.
[12]Sun D, Guan X, Moran AE, Wu L-Y, Qian DZ, Schedin P, et al. Identifying phenotype-associated subpopulations by integrating bulk and single-cell sequencing data. Nat Biotechnol 2022;40:527–38. https://doi.org/10.1038/s41587-021-01091-3.
[13]Szklarczyk D, Kirsch R, Koutrouli M, Nastou K, Mehryary F, Hachilif R, et al. The STRING database in 2023: protein-protein association networks and functional enrichment analyses for any sequenced genome of interest. Nucleic Acids Res 2023;51:D638–46. https://doi.org/10.1093/nar/gkac1000.
[14]Zeng D, Ye Z, Shen R, Yu G, Wu J, Xiong Y, et al. IOBR: Multi-Omics Immuno-Oncology Biological Research to Decode Tumor Microenvironment and Signatures. Front Immunol 2021;12:687975. https://doi.org/10.3389/fimmu.2021.687975.
[15]Mostafavi S, Ray D, Warde-Farley D, Grouios C, Morris Q. GeneMANIA: a real-time multiple association network integration algorithm for predicting gene function. Genome Biol 2008;9 Suppl 1:S4. https://doi.org/10.1186/gb-2008-9-s1-s4.
[16]Huang P, Ouyang D-J, Chang S, Li M-Y, Li L, Li Q-Y, et al. Chemotherapy-driven increases in the CDKN1A/PTN/PTPRZ1 axis promote chemoresistance by activating the NF-κB pathway in breast cancer cells. Cell Commun Signal CCS 2018;16:92. https://doi.org/10.1186/s12964-018-0304-4.
[17]Saha Detroja T, Detroja R, Mukherjee S, Samson AO. Identifying Hub Genes Associated with Neoadjuvant Chemotherapy Resistance in Breast Cancer and Potential Drug Repurposing for the Development of Precision Medicine. Int J Mol Sci 2022;23:12628. https://doi.org/10.3390/ijms232012628.
[18]Du Y, Han Y, Wang X, Wang H, Qu Y, Guo K, et al. Identification of Immune-Related Breast Cancer Chemotherapy Resistance Genes via Bioinformatics Approaches. Front Oncol 2022;12:772723. https://doi.org/10.3389/fonc.2022.772723.
[19]Liutkauskiene S, Grizas S, Jureniene K, Suipyte J, Statnickaite A, Juozaityte E. Retrospective analysis of the impact of anthracycline dose reduction and chemotherapy delays on the outcomes of early breast cancer molecular subtypes. BMC Cancer 2018;18:453. https://doi.org/10.1186/s12885-018-4365-y.
[20]Matsushita Y, Nakagawa H, Koike K. Lipid Metabolism in Oncology: Why It Matters, How to Research, and How to Treat. Cancers 2021;13:474. https://doi.org/10.3390/cancers13030474.
[21]Peetla C, Bhave R, Vijayaraghavalu S, Stine A, Kooijman E, Labhasetwar V. Drug resistance in breast cancer cells: biophysical characterization of and doxorubicin interactions with membrane lipids. Mol Pharm 2010;7:2334–48. https://doi.org/10.1021/mp100308n.
[22]Kravchenko DS, Frolova EI, Kravchenko JE, Chumakov SP. [Role of PDLIM4 and c-Src in Breast Cancer Progression]. Mol Biol (Mosk) 2016;50:69–79. https://doi.org/10.7868/S0026898416010092.
[23]Jelinek J, Gharibyan V, Estecio MRH, Kondo K, He R, Chung W, et al. Aberrant DNA methylation is associated with disease progression, resistance to imatinib and shortened survival in chronic myelogenous leukemia. PloS One 2011;6:e22110. https://doi.org/10.1371/journal.pone.0022110.
[24]He M, Vanaja DK, Karnes RJ, Young CYF. Epigenetic regulation of Myc on retinoic acid receptor beta and PDLIM4 in RWPE1 cells. The Prostate 2009;69:1643–50. https://doi.org/10.1002/pros.21013.
[25]Kravchenko DS, Ivanova AE, Podshivalova ES, Chumakov SP. PDLIM4/RIL-mediated regulation of Src and malignant properties of breast cancer cells. Oncotarget 2020;11:22–30. https://doi.org/10.18632/oncotarget.27410.
[26]Liao S, Liu C, Zhu G, Wang K, Yang Y, Wang C. Relationship between SDC1 and cadherin signalling activation in cancer. Pathol Res Pract 2020;216:152756. https://doi.org/10.1016/j.prp.2019.152756.
[27]Nikolova V, Koo C-Y, Ibrahim SA, Wang Z, Spillmann D, Dreier R, et al. Differential roles for membrane-bound and soluble syndecan-1 (CD138) in breast cancer progression. Carcinogenesis 2009;30:397–407. https://doi.org/10.1093/carcin/bgp001.
[28]Yang Y, Tao X, Li C-B, Wang C-M. MicroRNA-494 acts as a tumor suppressor in pancreatic cancer, inhibiting epithelial-mesenchymal transition, migration and invasion by binding to SDC1. Int J Oncol 2018;53:1204–14. https://doi.org/10.3892/ijo.2018.4445.
[29]Tang W, Morgan DR, Meyers MO, Dominguez RL, Martinez E, Kakudo K, et al. Epstein-barr virus infected gastric adenocarcinoma expresses latent and lytic viral transcripts and has a distinct human gene expression profile. Infect Agent Cancer 2012;7:21. https://doi.org/10.1186/1750-9378-7-21.
[30]Pap Z, Pávai Z, Dénes L, Kovalszky I, Jung J. An immunohistochemical study of colon adenomas and carcinomas: E-cadherin, Syndecan-1, Ets-1. Pathol Oncol Res POR 2009;15:579–87. https://doi.org/10.1007/s12253-009-9157-x.
[31]Wang Y-W, Cheng H-L, Ding Y-R, Chou L-H, Chow N-H. EMP1, EMP 2, and EMP3 as novel therapeutic targets in human cancer. Biochim Biophys Acta Rev Cancer 2017;1868:199–211. https://doi.org/10.1016/j.bbcan.2017.04.004.
[32]Wang Q, Li D, Ma H, Li Z, Wu J, Qiao J, et al. Tumor cell-derived EMP1 is essential for cancer-associated fibroblast infiltration in tumor microenvironment of triple-negative breast cancer. Cell Death Dis 2025;16:143. https://doi.org/10.1038/s41419-025-07464-9.
[33]Kumari A, Pal Pathak D, Asthana S. Bile acids mediated potential functional interaction between FXR and FATP5 in the regulation of Lipid Metabolism. Int J Biol Sci 2020;16:2308–22. https://doi.org/10.7150/ijbs.44774.
[34]Zhang J, Gao L-Z, Chen Y-J, Zhu P-P, Yin S-S, Su M-M, et al. Continuum of Host-Gut Microbial Co-metabolism: Host CYP3A4/3A7 are Responsible for Tertiary Oxidations of Deoxycholate Species. Drug Metab Dispos Biol Fate Chem 2019;47:283–94. https://doi.org/10.1124/dmd.118.085670.
[35]Heo J, Eki R, Abbas T. Deregulation of F-box proteins and its consequence on cancer development, progression and metastasis. Semin Cancer Biol 2016;36:33–51. https://doi.org/10.1016/j.semcancer.2015.09.015.
[36]Alli RS, Khar A. Dendritic cells as natural adjuvants and modulators of immune response in cancer immunotherapy. Indian J Biochem Biophys 2002;39:363–7.
[37]Liu J, Li H-J, Luo Y-L, Chen Y-F, Fan Y-N, Du J-Z, et al. Programmable Delivery of Immune Adjuvant to Tumor-Infiltrating Dendritic Cells for Cancer Immunotherapy. Nano Lett 2020;20:4882–9. https://doi.org/10.1021/acs.nanolett.0c00893.
[38]Lu Y, Zhu W, Zhang GX, Chen JC, Wang QL, Mao MY, et al. Adenosine A2A receptor activation regulates the M1 macrophages activation to initiate innate and adaptive immunity in psoriasis. Clin Immunol Orlando Fla 2024;266:110309. https://doi.org/10.1016/j.clim.2024.110309.
Peer-review Terminology
Identity transparency: Single anonymized
Reviewer interacts with: Editor
Details
This is an open access article under the terms of the Creative Commons Attribution License(http://creativecommons.org/licenses/by/4.0/), which permits use, distribution and reproduction in any medium, provided the original work is properly cited.
Publication History
Received 2025-04-07
Accepted 2025-04-25
Published 2025-05-14