


Abstract
Introduction:White matter hyperintensities (WMHs) are common neuroimaging markers of cerebral small vessel disease (CSVD) and are strongly associated with cognitive impairment. While cerebral hypoperfusion and neuroinflammation are recognized as major contributors to WMH pathology, the interplay between inflammatory biomarkers and cerebral blood flow (CBF) remains poorly understood. Soluble triggering receptor expressed on myeloid cells 2 (sTREM2), a marker of microglial activation, may play a dual role in neuroinflammation and vascular dysfunction.
Methods:A total of 138 participants aged 50–80 years were enrolled, including 75 individuals in WMH group and 63 individuals in healthy control (HC) group. All subjects underwent magnetic resonance imaging (MRI) including arterial spin labeling(ASL) for CBF quantification and neuropsychological assessments. Serum sTREM2 levels were measured. Group comparisons, logistic regression, and partial correlation analyses were performed to explore associations among sTREM2, CBF, and cognitive performance.
Results:Compared to HC group, serum sTREM2 levels were significantly elevated in the WMH group (P = 0.036), and gray matter(GM) CBF was significantly lower (P = 0.038). Logistic regression identified sTREM2 (OR = 1.041, P = 0.006) and age (OR = 1.081, P = 0.018) as independent risk factors for WMHs. Partial correlation analyses revealed a positive association between sTREM2 and gray matter CBF in healthy controls, but a negative association in the WMH group. Additionally, GM CBF was positively correlated with global cognitive scores (MMSE, MoCA) and executive function (Stroop Test C) in the WMH group.
Conclusion: Our findings suggest that higher serum sTREM2 levels and reduced brain perfusion may be closely linked to the presence and progression of white matter hyperintensities and associated cognitive decline. Notably, the direction of the relationship between sTREM2 and perfusion appears to vary by disease status, indicating a possible shift from compensatory to harmful inflammation. These results highlight the clinical value of combining inflammatory markers and perfusion imaging in identifying individuals at higher risk of small vessel-related cognitive impairment and may provide useful targets for early intervention and monitoring.
Keywords:Soluble triggering receptor expressed on myeloid cells 2, White matter hyperintensities, cerebral blood flow , Cognitive impairment
Introduction
White matter hyperintensities (WMHs) are among the most prevalent neuroimaging abnormalities observed in older adults, typically appearing as hyperintense lesions in cerebral white matter on T2-weighted or fluid-attenuated inversion recovery (FLAIR) magnetic resonance imaging (MRI)[1] . WMHs are widely recognized as radiological indicators of cerebral small vessel disease (CSVD), and their underlying pathology includes demyelination, gliosis, chronic ischemia, and microinfarctions[2,3] . With the global acceleration of population aging, the incidence of cognitive impairment and dementia continues to rise, and cognitive decline has emerged as a central concern in aging and neurology research[4,5] . Increasing evidence suggests that WMHs serve as independent risk factors for cognitive deterioration[6] .
Chronic cerebral hypoperfusion is considered one of the principal mechanisms contributing to WMH development[7-9] . Prolonged reductions in cerebral blood flow (CBF) lead to brain tissue hypoxia and metabolic dysfunction, which in turn initiate a cascade of pathophysiological processes[10,11] . Studies have shown that reduced CBF can trigger the release of pro-inflammatory cytokines, activate the coagulation cascade and endothelial cells, and promote vascular leakage through the disruption of endothelial integrity[12,13] . These processes lead to the extravasation of inflammatory mediators, the release of proteases and reactive oxygen species, and subsequent compromise of the blood–brain barrier (BBB). Endothelial dysfunction and BBB breakdown further facilitate inflammatory responses and neuronal injury, thereby impairing white matter metabolism and myelin integrity[14-16] . Ultimately, such changes disrupt neural network efficiency and contribute to deficits in executive function, attention, and information processing speed[17,18] . Accordingly, cerebral perfusion has gained increasing recognition as a critical intermediary factor linking WMH burden to cognitive impairment.
In recent years, circulating biomarkers have shown promise in the diagnosis and monitoring of WMH-related pathology[19-21] . Such biomarkers not only reflect the underlying pathophysiological processes but may also serve as tools for early detection and prognosis. Triggering receptor expressed on myeloid cells 2 (TREM2) belongs to the immunoglobulin superfamily and is cleaved to generate its soluble form, sTREM2, which is detectable in cerebrospinal fluid (CSF) and peripheral blood[22,23] . sTREM2 is a well-established marker of microglial activation and neuroinflammation, and elevated levels have been reported in various neurodegenerative diseases, where they are closely associated with inflammatory responses and neuronal damage[24-26] .
In the context of CSVD and WMHs, elevated sTREM2 levels have been associated with increased white matter damage, cerebrovascular dysfunction, and cognitive decline[27,28] . For example, a longitudinal analysis demonstrated that higher baseline CSF sTREM2 levels were predictive of progression in CSVD imaging markers—such as cerebral microbleeds(CMBs) and WMH volume—particularly among individuals with concurrent Alzheimer’s disease (AD) pathology, including β-amyloid (Aβ) deposition and tau phosphorylation[29] . Notably, sTREM2 may exert stage-dependent effects. In early AD, elevated sTREM2 levels have been interpreted as part of a compensatory neuroprotective response, whereas in later stages, microglial functional exhaustion may lead to reduced sTREM2 release[30] . A similar dynamic may be present in CSVD progression.
Mechanistically, TREM2 signaling regulates microglial metabolism and inflammatory responses, facilitating phagocytosis, activation, survival, and proliferation[31-33] . Previous studies have reported positive associations between WMH volume and plasma sTREM2 concentrations[27] . Moreover, in animal models of chronic cerebral hypoperfusion, TREM2 appears to play a neuroprotective role[34] . Despite these findings, human studies investigating the relationship between sTREM2 and cerebral perfusion remain scarce, highlighting an important gap in the literature.
Although both sTREM2 and cerebral perfusion are independently associated with WMH burden and cognitive function, few studies have explored their combined effects or potential interactions. Therefore, the present study aims to investigate the influence of serum sTREM2 levels and cerebral perfusion on WMH volume and cognitive impairment. By focusing on the potential interplay between neuroinflammation and cerebral blood flow, this research seeks to uncover mechanistic insights into WMH-related cognitive dysfunction and contribute to the development of biomarkers and strategies for early detection and intervention.
Methods
Subjects
A total of 138 participants were enrolled in this study, including 75 individuals with WMH confirmed by brain MRI, who were assigned to the WMH group, and 63 individuals without significant white matter abnormalities, who served as the healthy control (HC) group. Inclusion criteria were as follows: (1) age between 50 and 80 years; (2) no contraindications to MRI examination; and (3) ability to cooperate with cognitive assessments. All participants underwent standardized brain MRI scanning, and the severity of WMHs was assessed using the Fazekas scale. Periventricular WMHs (PVWMHs) and deep WMHs (DWMHs) were each rated on a scale from 0 to 3 (0 = no lesions; 1 = punctate or mild focal lesions; 2 = beginning confluence of lesions; 3 = large confluent lesions). The sum of PVWMH and DWMH scores was defined as the total Fazekas score, which was used to quantify overall WMH burden. Participants with a total score of 0–2 were classified into the HC group, while those with scores of 3–6 were assigned to the WMH group.
Exclusion criteria included: (1) intracranial conditions such as traumatic brain injury, acute cerebral infarction, cerebral hemorrhage, or brain tumors; (2) a history of psychiatric disorders, such as depression or bipolar disorder; (3) other neurological diseases, including multiple sclerosis, neuromyelitis optica spectrum disorders, or hereditary and metabolic encephalopathies; (4) systemic malignant tumors; (5) acute or chronic inflammatory diseases of major organs (heart, liver, kidneys); (6) neurodegenerative diseases that could cause cognitive impairment, such as Alzheimer's disease, Parkinson's disease, frontotemporal dementia, or dementia with Lewy bodies; and (7) severe visual, auditory, or speech impairments that would interfere with neuropsychological testing.
As participants were consecutively recruited, no strict matching was performed for age, sex, or educational level between groups. Potential confounding variables were controlled for in the subsequent statistical analyses using covariate adjustment. The study was conducted in accordance with the ethical principles of the Declaration of Helsinki and was approved by the Ethics Committee of the First Affiliated Hospital of Anhui Medical University (Approval No. PJ2023-05-22). Written informed consent was obtained from all participants prior to inclusion.
Cognitive assessments
Neuropsychological evaluations were conducted for all participants by two senior neurologists, both of whom had undergone formal training in standardized cognitive assessment protocols to ensure high reliability and consistency in test administration. The battery of tests was designed to comprehensively assess multiple cognitive domains, including global cognition, memory, attention, and executive function. Core instruments employed in the evaluation included the Mini-Mental State Examination (MMSE) and Montreal Cognitive Assessment (MoCA) for general cognitive screening[35,36] ; the Auditory Verbal Learning Test (AVLT) for episodic memory; the Stroop Color-Word Test (SCWT) and Trail Making Test (TMT) for executive functioning and processing speed; and the Digit Span Test (DST) for attention and working memory capacity[37-40] .
Serum analysis
Following an overnight fast of no less than 8 hours, venous blood samples were obtained from all participants using vacuum tubes preloaded with inert separation gel and a clot activator. Samples were promptly centrifuged at 3500 revolutions per minute for 8 minutes to separate the serum. The supernatant was carefully aliquoted into labeled cryotubes and stored at –80°C until batch analysis. For biochemical evaluation, serum levels of sTREM2 were determined. Quantification of sTREM2 was performed via enzyme-linked immunosorbent assay (ELISA) using standardized protocols, and all assays were conducted at a certified third-party laboratory (Anhui Yipu-Nokang Medical Laboratory Co., Ltd.).
Image acquisition and data processing
All participants underwent brain MRI examinations at the Department of Medical Imaging, The First Affiliated Hospital of Anhui Medical University, using a 3.0 Tesla MRI scanner (Discovery MR750w, GE Healthcare, Milwaukee, WI, USA) equipped with a 24-channel phased-array head coil. During scanning, participants were positioned supine with their heads stabilized using foam pads, and earplugs were provided to reduce motion artifacts and acoustic noise. The imaging protocol included multiple sequences to capture structural and microstructural brain features: T1-weighted imaging (T1WI), T2-weighted imaging (T2WI), T2-fluid-attenuated inversion recovery (T2-FLAIR), and Arterial spin labeling (ASL). The detailed MRI acquisition parameters for each sequence were as follows:(1) T1-weighted imaging (T1WI): acquisition time = 4 min 56 s; number of slices = 188; slice thickness = 1.0 mm; repetition time (TR) = 8.464 ms; echo time (TE) = 3.248 ms; flip angle = 12°; field of view (FOV) = 256 × 256 mm²; matrix size = 256 × 256.(2) T2-weighted imaging (T2WI): acquisition time = 58 s; number of slices = 19; slice thickness = 5.0 mm; TR = 3500 ms; TE = 85 ms; flip angle = 90°; FOV = 230 × 184 mm²; matrix size = 512 × 512.(3) T2-fluid-attenuated inversion recovery (T2-FLAIR): acquisition time = 1 min 57 s; number of slices = 19; slice thickness = 7.0 mm; TR = 9000 ms; TE = 119.84 ms; flip angle = 160°; FOV = 225 × 225 mm²; matrix size = 512 × 512.(4) Arterial spin labeling (ASL): acquisition time = 4 min 54 s; number of slices = 50; slice thickness = 3.0 mm; TR = 5070 ms; TE = 11.48 ms; flip angle = 111°; FOV = 240 × 240 mm²; matrix size = 128 × 128; post-labeling delay (PLD) = 2000 ms.
Preprocessing of arterial spin labeling (ASL) data was initially performed using the GE scanner’s built-in workstation to generate CBF maps, following procedures described in previous studies. Subsequent analyses of the CBF images were conducted using the Statistical Parametric Mapping software (SPM8; Wellcome Department of Imaging Neuroscience, London, UK; https://www.fil.ion.ucl.ac.uk/spm), implemented in MATLAB. The preprocessing pipeline included the following key steps: (1) conversion of raw data from DICOM to NIFTI format and initial quality checks; (2) spatial normalization of individual CBF maps to the standard Montreal Neurological Institute (MNI) template using nonlinear registration; (3) voxel-wise standardization of CBF values by subtracting the mean global CBF and dividing by the standard deviation, yielding Z-score normalized maps to reduce inter-individual variability; (4) application of spatial smoothing with a 6 mm full-width at half-maximum (FWHM) Gaussian kernel; and (5) extraction of mean CBF values for the whole brain, gray matter, and white matter regions.
Statistical analysis
The Shapiro-Wilk test was used to assess the normality of all continuous variables. Normally distributed continuous variables are presented as mean ± standard deviation and compared using two-sample t-test. Non-normally distributed continuous variables are expressed as median (interquartile range) and compared using the Mann–Whitney U test. Categorical variables are described as frequencies (percentages) [n(%)] and compared using chi-square tests. We first compared demographic characteristics, serum sTREM2 levels, and CBF between the WMH and HC groups. To further identify the key risk factors associated with WMH, variables with significant intergroup differences—along with vascular risk factors including serum sTREM2, sex, age, education level, hypertension, diabetes, hyperlipidemia, heart disease, smoking history, alcohol consumption, and body mass index (BMI)—were entered into a binary logistic regression model. Finally, partial correlation analyses were conducted to examine the associations between sTREM2 and CBF, as well as between CBF and cognitive function, while adjusting for sex, age, and years of education as covariates. All statistical analyses were performed using SPSS version 23.0, with a significance threshold set at P < 0.05.
Results
Participant demographic and clinical characteristics
A total of 138 participants were enrolled in this study, including 63 in the healthy control (HC) group (36 females; median age: 59 [56,66] years; median years of education: 9 [5,11] ) and 75 in the white matter hyperintensity (WMH) group (37 females; median age: 64 [58,70] years; median years of education: 9 [5,11] ). There was a statistically significant difference in age between the HC and WMH groups (P = 0.004). No significant differences were found between the two groups in terms of sex, years of education, body mass index (BMI), hypertension, diabetes, hyperlipidemia, heart disease, smoking, or alcohol consumption history (all P > 0.05).The serum sTREM2 level was significantly higher in the WMH group [30.54(20.53,41.68)pg/mL] than in the HC group [28.74(16.50,34.45)pg/mL] (P = 0.036). Regarding neuropsychological assessments, significant group differences were observed in MMSE (P = 0.028), MoCA (P = 0.006), AVLT-5min (P = 0.016), AVLT-20min (P = 0.038), AVLT-Recognition (P = 0.009), SCWT-B (P = 0.014), SCWT-C (P = 0.034), TMT-A (P = 0.003), TMT-B (P = 0.002), DST-F (P = 0.024), and DST-B (P = 0.024). The WMH Fazekas score also differed significantly between the two groups (P < 0.001). Detailed results are presented in Table 1.
Table 1. Comparison of demographic characteristics, laboratory indicators, cognitive performance and CSVD imaging markers between groups.
|
HC group (n = 63) |
WMH group (n = 75) |
P value |
|
|
Demographics |
|
|
|
|
Female, n (%) |
36 (57.14) |
37 (49.33) |
0.360c |
|
Age (years) |
59 (56, 66) |
64 (58, 70) |
0.004b |
|
Education (years) |
9 (5, 11) |
9 (5, 11) |
0.387b |
|
BMI (kg/m²) |
23.67±2.85 |
23.90±2.94 |
0.710a |
|
Serum markers Test |
|
|
|
|
sTREM2 (pg/mL) |
28.74 (16.50, 34.45) |
30.54 (20.53, 41.68) |
0.036b |
|
Medical co-morbidities |
|
|
|
|
Hypertension, n (%) |
38 (60.12) |
50 (66.67) |
0.440c |
|
Diabetes mellitus, n (%) |
12 (19.05) |
7 (9.33) |
0.099c |
|
Hyperlipidemia, n (%) |
13 (20.63) |
21 (28.00) |
0.317c |
|
Heart disease, n (%) |
7 (11.11) |
6 (8.00) |
0.533c |
|
Smoking, n (%) |
16 (25.40) |
23 (30.67) |
0.493c |
|
Alcohol consumption, n (%) |
19 (30.16) |
27 (36.00) |
0.468c |
|
Cognition |
|
|
|
|
MMSE |
28 (26, 29) |
27 (26, 29) |
0.028b |
|
MoCA |
24 (21, 25) |
22 (19, 24) |
0.006b |
|
AVLT-Immediate |
15 (13, 18) |
14 (11, 17) |
0.065b |
|
AVLT-5min |
5 (4, 7) |
5 (3, 6) |
0.016b |
|
AVLT-20min |
5.22±2.50 |
4.32±2.54 |
0.038a |
|
AVLT-Recognition |
21 (18, 23) |
20 (18, 22) |
0.009b |
|
SCWT-A |
21.10 (16.54, 25.52) |
22.58 (17.74, 29.14) |
0.189b |
|
SCWT-B |
22.89 (19.66, 29.60) |
27.23 (21.57, 32.91) |
0.014b |
|
SCWT-C |
34.68 (29.16, 40.59) |
38.71 (31.11, 48.97) |
0.034b |
|
TMT-A |
61.12 (46.62, 82.59) |
79.91 (58.02, 111.66) |
0.003b |
|
TMT-B |
120.00 (80.00, 180.64) |
180.30 (103.27, 300.00) |
0.002b |
|
DST-F |
13 (10, 16) |
12 (9, 14) |
0.078b |
|
DST-B |
6 (5, 8) |
6 (4, 8) |
0.038b |
|
WMH Fazekas score |
2 (1, 2) |
4 (3, 6) |
< 0.001b |
Significant differences are indicated in bold. Abbreviations: BMI: body mass index; sTREM2: soluble triggering receptor expressed on myeloid cells 2; MMSE: Mini-Mental State Examination; MoCA: Montreal Cognitive Assessment; AVLT: Auditory Verbal Learning Test; SCWT: Stroop Color Word Test; TMT: Trail Making Test; DST-F: Digit Span Forward Test; DST-B: Digit Span Backward Test; HC: healthy control; WMH: white matter hyperintensity; a: two independent samples t-tests; b: Mann–Whitney U test; c: chi-square tests.
Binary logistic regression analysis of risk factors for WMH
To further investigate the key risk factors for WMH, variables that showed intergroup differences and vascular risk factors—including serum sTREM2, sex, age, years of education, hypertension, diabetes, hyperlipidemia, heart disease, smoking history, alcohol consumption history, and BMI—were included in a binary logistic regression model (Table 2). The results indicated that, after adjusting for potential confounders, only serum sTREM2 (B = 0.040, P = 0.006) and age (B = 0.078, P = 0.018) remained significant independent risk factors for vascular WMH.
Table 2. Binary logistic regression analysis of risk factors for WMH
|
B |
SE |
Walds |
P value |
OR(95% CI) |
|
|
sTREM2 |
0.040 |
0.014 |
7.692 |
0.006 |
1.041(1.012, 1.071) |
|
Sex |
0.445 |
0.617 |
0.519 |
0.471 |
1.560(0.466, 5.225) |
|
Age |
0.078 |
0.033 |
5.626 |
0.018 |
1.081(1.014, 1.153) |
|
Education |
-0.057 |
0.062 |
0.843 |
0.358 |
0.945(0.838, 1.066) |
|
Hypertension |
0.068 |
0.497 |
0.019 |
0.891 |
1.070(0.404, 2.835) |
|
Diabetes mellitus |
-1.217 |
0.681 |
3.198 |
0.074 |
0.296(0.078, 1.124) |
|
Hyperlipidemia |
0.941 |
0.548 |
2.945 |
0.086 |
2.561(0.875, 7.498) |
|
Heart disease |
-0.261 |
0.696 |
0.140 |
0.708 |
0.770(0.197, 3.015) |
|
Smoking |
0.143 |
0.727 |
0.039 |
0.844 |
1.154(0.277, 4.799) |
|
Alcohol consumption |
-0.451 |
0.630 |
0.512 |
0.474 |
0.637(0.185, 2.189) |
|
BMI |
-0.010 |
0.082 |
0.014 |
0.905 |
0.990(0.842, 1.164) |
Significant differences are indicated in bold. Abbreviations: sTREM2, soluble triggering receptor expressed on myeloid cells 2; BMI, body mass index; WMH, white matter hyperintensity; B, regression coefficient; SE, standard error; Wald, Wald chi-square test; OR (95% CI), odds ratio (95% confidence interval).
Comparison of CBF between the two groups
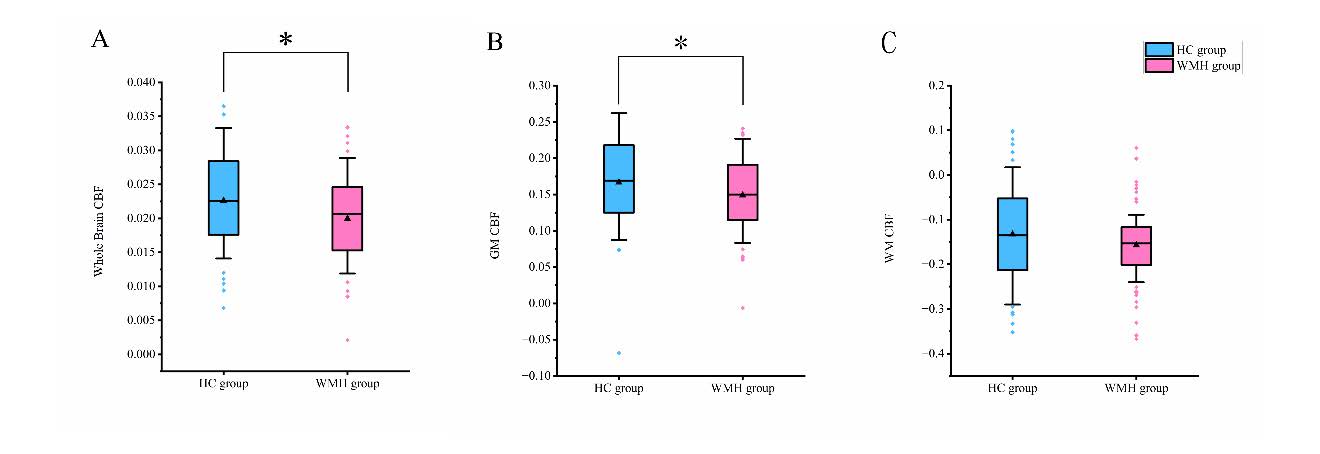
As shown in Figure 1, there were significant differences in cerebral blood flow (CBF) between the HC and WMH groups. Specifically, significant group differences were observed in global CBF (P = 0.018) and gray matter CBF (P = 0.038), while the difference in white matter CBF did not reach statistical significance (P = 0.134).
Figure 1. Group comparisons of Whole brain CBF (A), GM CBF(B), WM CBF(C). Abbreviations: HC: healthy control; WMH: white matter hyperintensity; CBF: Cerebral Blood Flow; GM: Gray Matter; WM: White Matter; *: p < 0.05.
Partial correlation analysis of sTREM2 levels and CBF
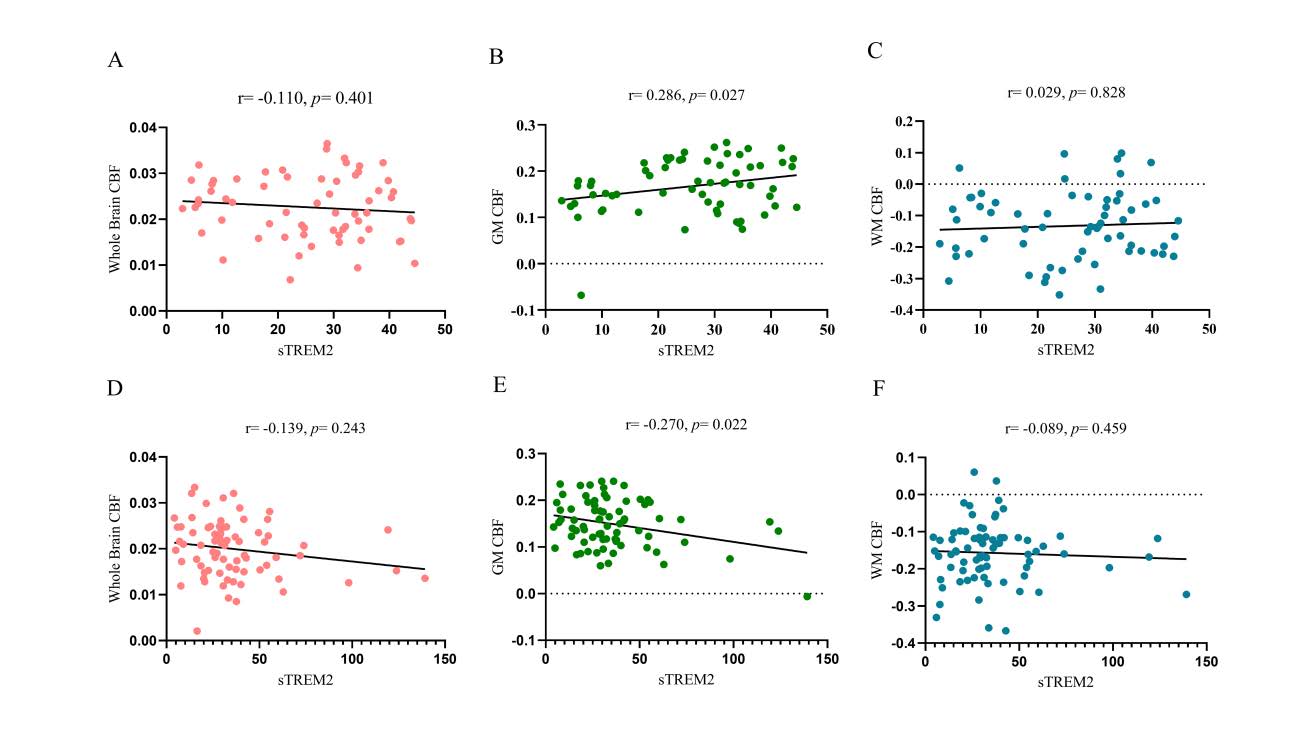
After adjusting for sex, age, and years of education as covariates, partial correlation analyses were performed within the HC and WMH groups to examine the relationships between serum sTREM2 levels and whole brain CBF, gray matter (GM) CBF, and white matter (WM) CBF. The results showed that in the HC group, sTREM2 levels were positively correlated with GM CBF, whereas in the WMH group, sTREM2 levels were negatively correlated with GM CBF.
Figure 2. Partial correlation analyses were conducted between serum sTREM2 levels and whole brain CBF (A), gray matter (GM) CBF (B), and white matter (WM) CBF (C) in the HC group, and between sTREM2 levels and whole brain CBF (D), GM CBF (E), and WM CBF (F) in the WMH group, with sex, age, and years of education included as covariates. The results revealed a positive correlation between sTREM2 levels and GM CBF in the HC group (B), and a negative correlation in the WMH group (E). No significant correlations were observed between sTREM2 levels and whole brain CBF or WM CBF in either group (A, C, D, F). See Figure 2 for details. Abbreviations: sTREM2: soluble triggering receptor expressed on myeloid cells 2; HC: healthy control; WMH: white matter hyperintensity; CBF: Cerebral Blood Flow; GM: Gray Matter; WM: White Matter.
Partial correlation analysis of GM CBF and global cognitive function
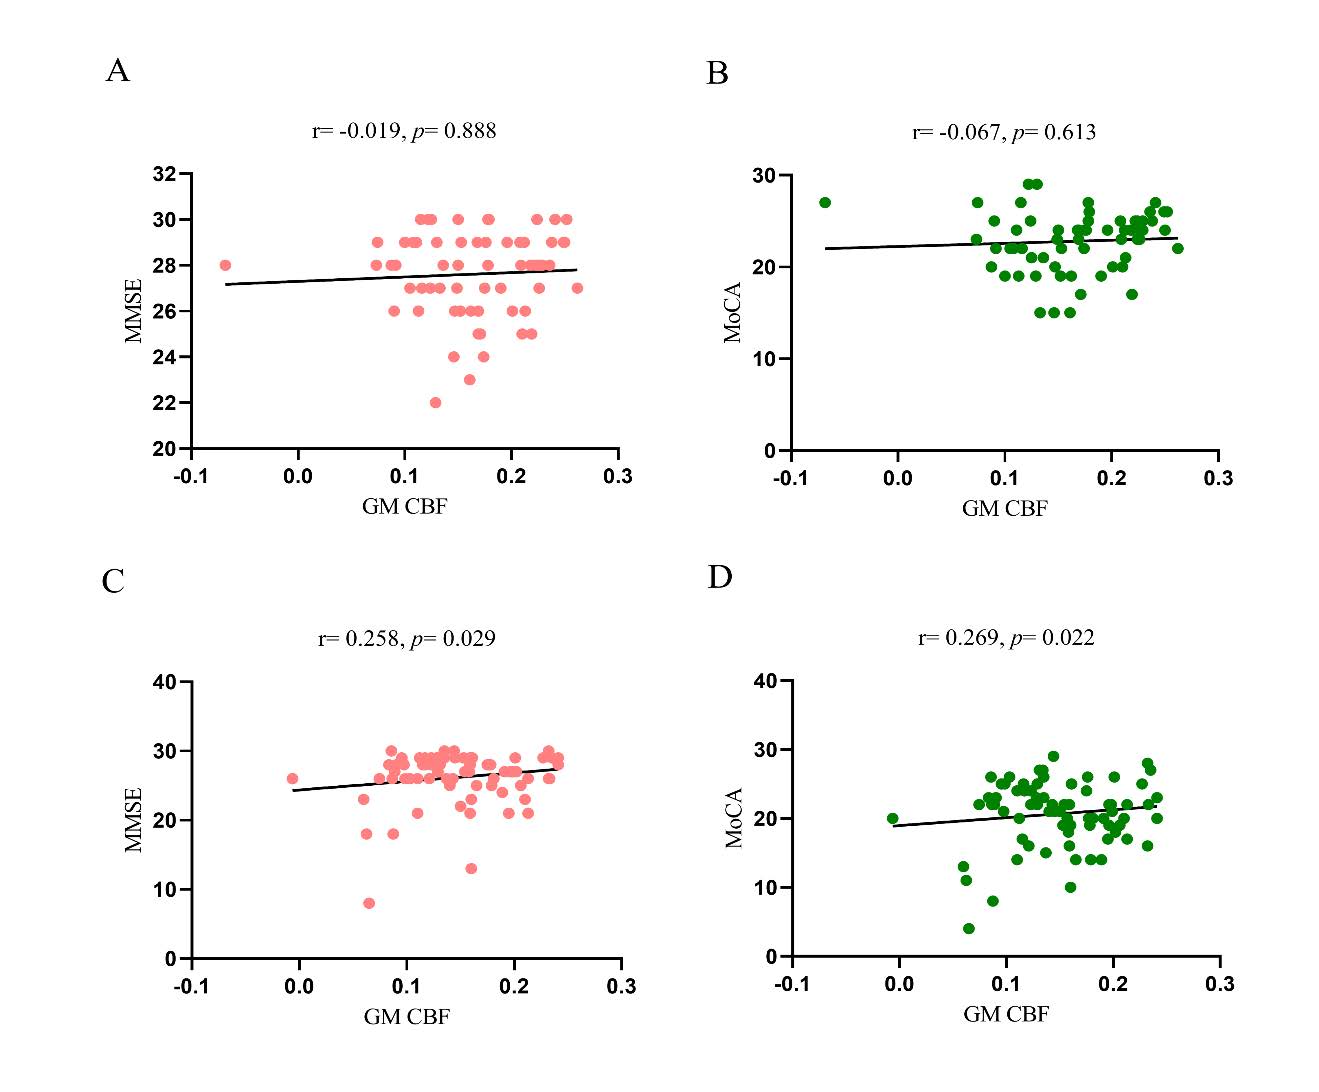
After adjusting for sex, age, and years of education as covariates, partial correlation analyses were conducted within the HC and WMH groups to examine the relationship between GM CBF and global cognitive performance. The results showed that there was no significant correlation between GM CBF and global cognition (MMSE, MoCA) in the HC group, whereas a positive correlation was observed in the WMH group.
Figure 3. Partial correlation analyses were performed between GM CBF and MMSE (A), and MoCA (B) in the HC group, and between GM CBF and MMSE (C), and MoCA (D) in the WMH group, with sex, age, and years of education included as covariates. No significant correlations were found between GM CBF and MMSE (A) or MoCA (B) in the HC group. In contrast, positive correlations were observed between GM CBF and both MMSE (C) and MoCA (D) in the WMH group. See Figure 3 for details. Abbreviations: MMSE: Mini-Mental State Examination; MoCA: Montreal Cognitive Assessment; HC: healthy control; WMH: white matter hyperintensity; CBF: Cerebral Blood Flow; GM: Gray Matter; WM: White Matter.
Partial correlation analysis of GM CBF and cognitive subdomains
After adjusting for sex, age, and years of education as covariates, partial correlation analyses were conducted within the HC and WMH groups to examine the relationship between GM CBF and cognitive subdomains. The results showed a significant correlation between GM CBF and SCWT-C in the HC group and WMH group.
Table 3. Partial correlation analysis of GM CBF and cognitive subdomains
|
HC group |
WMH group |
|||
|
|
r |
P value |
r |
P value |
|
AVLT-Immediate |
-0.157 |
0.238 |
0.088 |
0.467 |
|
AVLT-5min |
-0.104 |
0.438 |
0.188 |
0.116 |
|
AVLT-20min |
-0.074 |
0.583 |
0.049 |
0.686 |
|
AVLT-Recognition |
-0.109 |
0.414 |
0.128 |
0.289 |
|
SCWT-A |
0.225 |
0.089 |
-0.077 |
0.526 |
|
SCWT-B |
0.144 |
0.281 |
-0.151 |
0.207 |
|
SCWT-C |
0.285 |
0.030 |
-0.252 |
0.034 |
|
TMT-A |
-0.008 |
0.950 |
-0.128 |
0.289 |
|
TMT-B |
0.013 |
0.923 |
-0.216 |
0.070 |
|
DST-F |
0.106 |
0.430 |
0.125 |
0.297 |
|
DST-B |
0.106 |
0.430 |
0.204 |
0.088 |
Significant differences are indicated in bold. Abbreviations: MMSE: Mini-Mental State Examination; MoCA: Montreal Cognitive Assessment; AVLT: Auditory Verbal Learning Test; SCWT: Stroop Color Word Test; TMT: Trail Making Test; DST-F: Digit Span Forward Test; DST-B: Digit Span Backward Test; HC: healthy control; WMH: white matter hyperintensity; CBF: Cerebral Blood Flow; GM: Gray Matter.
Discussion
This study explores the mechanistic role of the inflammatory marker sTREM2 and CBF in the development of WMH and associated cognitive impairment. Our results revealed that serum sTREM2 levels were significantly elevated, while GM CBF was markedly reduced in the WMH group compared to HC group. sTREM2 was identified as an independent risk factor for WMH. Notably, the correlation between sTREM2 and GM CBF was positive in the HC group but negative in the WMH group. Moreover, a significant inverse correlation between GM CBF and cognitive scores (MMSE and MoCA) was observed only in the WMH group. Partial correlation analyses further demonstrated associations between GM CBF and Stroop Test C scores in both groups. These findings suggest a complex interplay between inflammation and cerebral perfusion that may be critical in WMH pathogenesis and cognitive decline.
TREM2 is a pattern recognition receptor selectively expressed by microglia in the central nervous system, involved in microglial activation, phagocytosis, and proliferation[24] . Upon activation, microglia polarize into either a pro-inflammatory M1 phenotype or an anti-inflammatory M2 phenotype. M1 microglia release inflammatory cytokines and neurotoxic substances, whereas M2 microglia secrete anti-inflammatory and neurotrophic factors, contributing to neuroprotection. TREM2 is generally considered anti-inflammatory; for instance, in murine models of cerebral hemorrhage, TREM2 attenuates neuroinflammation by downregulating the TLR4/NF-κB signaling pathway[41] . However, serum sTREM2 represents a soluble form cleaved from the membrane-bound receptor and may act as a competitive inhibitor, potentially interfering with TREM2-mediated anti-inflammatory signaling and diminishing its protective effects[42] .
Tsai[27] et al. reported a positive association between plasma sTREM2 levels and WMH volume in patients with AD and cerebral amyloid angiopathy or hypertensive small vessel disease. Additionally, a longitudinal study utilizing data from the ADNI cohort found that elevated CSF sTREM2 levels were positively correlated with CSVD progression, especially CMB[29] . These findings highlight the role of sTREM2 in the evolution of CSVD imaging biomarkers, particularly WMH. In light of current literature and our findings, we propose that sTREM2 may exert pro-inflammatory effects under pathological conditions.
WMH pathogenesis is multifactorial and involves cerebral hypoperfusion, BBB dysfunction, inflammation, and oxidative stress[43-45] . These factors interact to induce white matter injury. Inflammatory responses can compromise the integrity of cerebral endothelial cells and promote BBB breakdown. Subsequent endothelial dysfunction impairs vasoregulatory capacity, leading to chronic hypoxia and a cascade of inflammatory mediators that exacerbate demyelination[46-49] . BBB disruption also facilitates the entry of plasma-derived neurotoxins into brain parenchyma, amplifying oxidative stress and excitotoxicity, thereby aggravating white matter damage[50-53] . These processes collectively disrupt neurovascular coupling and contribute to cognitive deterioration. In our study, the inverse correlation between sTREM2 and GM CBF in the WMH group supports the hypothesis that sTREM2-mediated inflammation impairs microvascular function and reduces perfusion. Furthermore, GM CBF was significantly lower in the WMH group and negatively correlated with MMSE and MoCA scores, suggesting that hypoperfusion not only reflects structural damage but may also directly impair cognitive function[54,55] .
Of particular interest is the divergent correlation between sTREM2 and GM CBF: positive in the HC group and negative in the WMH group. This may indicate a dynamic shift in the function of sTREM2 across disease states. We hypothesize that in early or non-pathological states, moderate elevations in sTREM2 may reflect a compensatory immune response, where activated microglia secrete anti-inflammatory cytokines and stabilize endothelial function, thereby supporting vasodilation and cerebral perfusion. However, as pathology progresses, prolonged and excessive stimulation may cause compensatory mechanisms to fail. Sustained elevation of sTREM2 may then reflect uncontrolled inflammation, promoting endothelial injury and reducing perfusion. This transition from an initially protective response to a maladaptive pro-inflammatory state may explain the coexistence of high sTREM2 levels with hypoperfusion in moderate-to-severe WMH cases.
Stroop Test C evaluates the brain’s ability to resolve cognitive conflict, serving as a sensitive measure of executive function[56,57] . It requires suppression of automatic responses and engagement in effortful cognitive control, placing high demand on prefrontal cortex function. Executive dysfunction is a hallmark of WMH-related cognitive impairment. This domain relies on intact fronto-subcortical networks involving the prefrontal cortex, basal ganglia, and thalamus—regions particularly susceptible to chronic hypoperfusion and inflammation[58,59] . Our findings showed that GM CBF was negatively correlated with Stroop Test C scores in both groups, implying that even in the absence of overt cognitive deficits, reductions in perfusion may impair executive functioning. This underscores the early involvement of cerebral hypoperfusion in cognitive decline.
Integrating our results with existing evidence, we propose the following pathological cascade: peripheral or central inflammation activates microglia, leading to the release of sTREM2 and other inflammatory mediators, which damage cerebral microvasculature and increase BBB permeability. BBB disruption facilitates the entry of harmful substances into brain tissue, exacerbating inflammation and oxidative stress. This cascade impairs microvascular function and reduces CBF. Resultant hypoperfusion in white matter promotes demyelination and axonal degeneration, manifesting as WMH. Simultaneously, reduced perfusion in gray matter impairs the metabolic activity of key cognitive regions, especially the prefrontal cortex, ultimately resulting in global cognitive decline and executive dysfunction. Clinically, sTREM2 may serve as a biomarker of neuroinflammation and a prognostic indicator for WMH progression and cognitive outcomes. CBF, as a functional imaging biomarker, reflects the metabolic integrity and vulnerability of cerebral regions. Combined monitoring of inflammatory and perfusion markers could facilitate early identification of WMH and inform personalized interventions.
Despite its strengths, this study has several limitations. First, as a cross-sectional design, causality cannot be inferred. Longitudinal studies are required to elucidate the temporal relationship between sTREM2 dynamics and WMH-related cognitive decline. Second, our sample was limited in size and included only Chinese participants, necessitating validation in larger, more diverse populations. Third, advanced neuroimaging techniques, such as diffusion tensor imaging (DTI)[60,61] , were not employed to further elucidate the coupling between structural and functional alterations.
Conclusion
This study delineates a potential pathogenic pathway linking sTREM2, inflammation, and cerebral perfusion abnormalities to the development of WMH and cognitive impairment. Our findings suggest that inflammation-induced BBB disruption and CBF reduction may jointly contribute to white matter damage and subsequent cognitive decline. This mechanistic insight offers theoretical support for understanding WMH pathophysiology and highlights potential biomarkers and intervention targets for individualized clinical strategies.
Acknowledgements
This work was supported by the Scientific Research Projects of universities in Anhui Province, major projects (2022AH040159).
Funding information
the Scientific Research Projects of universities in Anhui Province, major projects (2022AH040159)
Competing Interests
The authors declare that they have no existing or potential commercial or financial relationships that could create a conflict of interest at the time of conducting this study.
Data Availability
All data needed to evaluate the conclusions in the paper are present in the paper or the Supplementary Materials. Additional data related to this paper may be requested from the authors.
References
[1] Shi Y, Toga AW. Connectome imaging for mapping human brain pathways. Mol Psychiatry. 2017;22(9):1230–1240. https://doi.org/10.1038/mp.2017.92
[2] Zotin MCZ, Sveikata L, Viswanathan A, Yilmaz P. Cerebral small vessel disease and vascular cognitive impairment: from diagnosis to management. Curr Opin Neurol. 2021;34(2):246–257. https://doi.org/10.1097/WCO.0000000000000913
[3] Mu R, Qin X, Guo Z, Meng Z, Liu F, Zhuang Z, et al. Prevalence and consequences of cerebral small vessel diseases: a cross-sectional study based on community people plotted against 5-year age strata. Neuropsychiatr Dis Treat. 2022;18:499–512. https://doi.org/10.2147/NDT.S352651
[4] Markus HS, de Leeuw FE. Cerebral small vessel disease: recent advances and future directions. Int J Stroke. 2023;18(1):4–14. https://doi.org/10.1177/17474930221144911
[5] Quinn TJ, Makin S, Doubal F, Staals J. Cerebral small vessel disease and vascular cognitive impairment. In: Touyz RM, Delles C, editors. Textbook of Vascular Medicine. Cham: Springer; 2019. p. 449–459. https://doi.org/10.1007/978-3-030-16481-2_42
[6] Bahrani AA, Powell DK, Yu G, Johnson ES, Jicha GA, Smith CD. White matter hyperintensity associations with cerebral blood flow in elderly subjects stratified by cerebrovascular risk. J Stroke Cerebrovasc Dis. 2017;26(4):779–786. https://doi.org/10.1016/j.jstrokecerebrovasdis.2016.10.017
[7] Ishibashi M, Kimura N, Aso Y, Matsubara E. Effects of white matter lesions on brain perfusion in patients with mild cognitive impairment. Clin Neurol Neurosurg. 2018;168:7–11. https://doi.org/10.1016/j.clineuro.2018.02.030
[8] Stewart CR, Stringer MS, Shi Y, Thrippleton MJ, Wardlaw JM. Associations between white matter hyperintensity burden, cerebral blood flow and transit time in small vessel disease: an updated meta-analysis. Front Neurol. 2021;12:647848. https://doi.org/10.3389/fneur.2021.647848
[9] Crane DE, Black SE, Ganda A, Mikulis DJ, Nestor SM, Donahue MJ, et al. Gray matter blood flow and volume are reduced in association with white matter hyperintensity lesion burden: a cross-sectional MRI study. Front Aging Neurosci. 2015;7:131. https://doi.org/10.3389/fnagi.2015.00131
[10] O’Sullivan M, Lythgoe DJ, Pereira AC, Summers PE, Jarosz JM, Williams SC, et al. Patterns of cerebral blood flow reduction in patients with ischemic leukoaraiosis. Neurology. 2002;59(3):321–326. https://doi.org/10.1212/WNL.59.3.321
[11] Crane DE, Black SE, Ganda A, Mikulis DJ, Nestor SM, Donahue MJ, et al. Gray matter blood flow and volume are reduced in association with white matter hyperintensity lesion burden: a cross-sectional MRI study. Front Aging Neurosci. 2015;7:131. https://doi.org/10.3389/fnagi.2015.00131
[12] Kim CM, Alvarado RL, Stephens K, Wey HY, Wang DJJ, Leritz EC, et al. Associations between cerebral blood flow and structural and functional brain imaging measures in individuals with neuropsychologically defined mild cognitive impairment. Neurobiol Aging. 2020;86:64–74. https://doi.org/10.1016/j.neurobiolaging.2019.10.023
[13] Ten Dam VH, van den Heuvel DMJ, de Craen AJM, Bollen ELEM, Murray HM, Westendorp RGJ, et al. Decline in total cerebral blood flow is linked with increase in periventricular but not deep white matter hyperintensities. Radiology. 2007;243(1):198–203. https://doi.org/10.1148/radiol.2431052111
[14] Brickman AM, Zahra A, Muraskin J, Steffener J, Holland CM, Habeck C, et al. Reduction in cerebral blood flow in areas appearing as white matter hyperintensities on magnetic resonance imaging. Psychiatry Res Neuroimaging. 2009;172(2):117–120. https://doi.org/10.1016/j.pscychresns.2008.11.006
[15] Wardlaw JM, Doubal FN, Valdés-Hernández M, Wang X, Chappell FM, Shuler K, et al. Blood–brain barrier permeability and long-term clinical and imaging outcomes in cerebral small vessel disease. Stroke. 2013;44(2):525–527. https://doi.org/10.1161/STROKEAHA.112.669994
[16] Li Y, Li M, Zhang X, Shi Q, Yang S, Fan H, et al. Higher blood–brain barrier permeability is associated with higher white matter hyperintensities burden. J Neurol. 2017;264(7):1474–1481. https://doi.org/10.1007/s00415-017-8550-8
[17] Gupta N, Simpkins AN, Hitomi E, Dias C, Leigh R, NIH Natural History of Stroke Investigators. White matter hyperintensity-associated blood-brain barrier disruption and vascular risk factors. J Stroke Cerebrovasc Dis. 2018;27(2):466–471. https://doi.org/10.1016/j.jstrokecerebrovasdis.2017.09.026
[18] Feng M, Wen H, Xin H, Wang S, Gao Y, Sui C, et al. Decreased local specialization of brain structural networks associated with cognitive dysfunction revealed by probabilistic diffusion tractography for different cerebral small vessel disease burdens. Mol Neurobiol. 2024;61(1):326–339. https://doi.org/10.1007/s12035-023-03597-0
[19] Tuladhar AM, Tay J, van Leijsen EMC, Lawrence AJ, van Uden IWM, Bergkamp MI, et al. Structural network changes in cerebral small vessel disease. J Neurol Neurosurg Psychiatry. 2020;91(2):196–203. https://doi.org/10.1136/jnnp-2019-321767
[20] Wan S, Dandu C, Han G, Guo Y, Ding Y, Song H, et al. Plasma inflammatory biomarkers in cerebral small vessel disease: a review. CNS Neurosci Ther. 2023;29(2):498–515. https://doi.org/10.1111/cns.14047
[21] Boehme AK, McClure LA, Zhang Y, Luna JM, Del Brutto OH, Benavente OR, et al. Inflammatory markers and outcomes after lacunar stroke: levels of inflammatory markers in treatment of stroke study. Stroke. 2016;47(3):659–667. https://doi.org/10.1161/STROKEAHA.115.012166
[22] Zhong L, Chen XF, Wang T, Wang Z, Liao C, Wang Z, et al. Soluble TREM2 induces inflammatory responses and enhances microglial survival. J Exp Med. 2017;214(3):597–607. https://doi.org/10.1084/jem.20160844
[23] Yang J, Fu Z, Zhang X, Xiong M, Meng L, Zhang Z, et al. TREM2 ectodomain and its soluble form in Alzheimer's disease. J Neuroinflammation. 2020;17:204. https://doi.org/10.1186/s12974-020-01878-2
[24] Park SH, Lee EH, Kim HJ, Jo S, Lee S, Seo SW, et al. The relationship of soluble TREM2 to other biomarkers of sporadic Alzheimer's disease. Sci Rep. 2021;11:13050. https://doi.org/10.1038/s41598-021-92101-6
[25] Rauchmann BS, Schneider-Axmann T, Alexopoulos P, Perneczky R, Alzheimer's Disease Neuroimaging Initiative. CSF soluble TREM2 as a measure of immune response along the Alzheimer's disease continuum. Neurobiol Aging. 2019;74:182–190. https://doi.org/10.1016/j.neurobiolaging.2018.10.022
[26] Rachmian N, Medina S, Cherqui U, Akiva H, Deitch D, Edilbi D, et al. Identification of senescent, TREM2-expressing microglia in aging and Alzheimer's disease model mouse brain. Nat Neurosci. 2024;27(6):1116–1124. https://doi.org/10.1038/s41593-024-01620-8
[27] Tsai HH, Chen YF, Yen RF, Lo YL, Yang KC, Jeng JS, et al. Plasma soluble TREM2 is associated with white matter lesions independent of amyloid and tau. Brain. 2021;144(11):3371–3380. https://doi.org/10.1093/brain/awab332
[28] Kwon HS, Lee EH, Park HH, Jin JH, Choi H, Lee KY, et al. Early increment of soluble triggering receptor expressed on myeloid cells 2 in plasma might be a predictor of poor outcome after ischemic stroke. J Clin Neurosci. 2020;73:215–218. https://doi.org/10.1016/j.jocn.2020.02.016
[29] Wu C, Ma YH, Hu H, Zhao B, Tan L, Alzheimer's Disease Neuroimaging Initiative. Soluble TREM2, Alzheimer's disease pathology, and risk for progression of cerebral small vessel disease: a longitudinal study. J Alzheimers Dis. 2023;92(1):311–322. https://doi.org/10.3233/JAD-220731
[30] Ma LZ, Tan L, Bi YL, Shen XN, Xu W, Ma YH, et al. Dynamic changes of CSF sTREM2 in preclinical Alzheimer's disease: the CABLE study. Mol Neurodegener. 2020;15:25. https://doi.org/10.1186/s13024-020-00374-8
[31] van Lengerich B, Zhan L, Xia D, Chan D, Joy D, Park JI, et al. A TREM2-activating antibody with a blood–brain barrier transport vehicle enhances microglial metabolism in Alzheimer's disease models. Nat Neurosci. 2023;26(3):416–429. https://doi.org/10.1038/s41593-022-01240-0
[32] Ruganzu JB, Zheng Q, Wu X, He Y, Peng X, Jin H, et al. TREM2 overexpression rescues cognitive deficits in APP/PS1 transgenic mice by reducing neuroinflammation via the JAK/STAT/SOCS signaling pathway. Exp Neurol. 2021;336:113506. https://doi.org/10.1016/j.expneurol.2020.113506
[33] Su R, Zhou T. Alpha-synuclein induced immune cells activation and associated therapy in Parkinson’s disease. Front Aging Neurosci. 2021;13:769506. https://doi.org/10.3389/fnagi.2021.769506
[34] Zhang J, Liu Y, Zheng Y, Luo Y, Du Y, Zhao Y, et al. TREM-2-p38 MAPK signaling regulates neuroinflammation during chronic cerebral hypoperfusion combined with diabetes mellitus. J Neuroinflammation. 2020;17(1):2. https://doi.org/10.1186/s12974-019-1688-9
[35] Folstein MF, Anthony JC, Parhad I, Duffy B, Gruenberg EM. The meaning of cognitive impairment in the elderly. J Am Geriatr Soc. 1985;33(4):228–235. https://doi.org/10.1111/j.1532-5415.1985.tb07109.x
[36] Bergeron D, Flynn K, Verret L, Poulin S, Bouchard RW, Bocti C, et al. Multicenter validation of an MMSE‐MoCA conversion table. J Am Geriatr Soc. 2017;65(5):1067–1072. https://doi.org/10.1111/jgs.14779
[37] Putcha D, Brickhouse M, Wolk DA, Dickerson BC. Fractionating the Rey Auditory Verbal Learning Test: Distinct roles of large-scale cortical networks in prodromal Alzheimer's disease. Neuropsychologia. 2019;129:83–92. https://doi.org/10.1016/j.neuropsychologia.2019.03.015
[38] Scarpina F, Tagini S. The Stroop color and word test. Front Psychol. 2017;8:557. https://doi.org/10.3389/fpsyg.2017.00557
[39] Wei M, Shi J, Li T, Ni J, Zhang X, Li Y, et al. Diagnostic accuracy of the Chinese version of the Trail-Making Test for screening cognitive impairment. J Am Geriatr Soc. 2018;66(1):92–99. https://doi.org/10.1111/jgs.15135
[40] Leung JL, Lee GT, Lam Y, Chan RC, Wu JY. The use of the Digit Span Test in screening for cognitive impairment in acute medical inpatients. Int Psychogeriatr. 2011;23(10):1569–1574. https://doi.org/10.1017/S1041610211001167
[41] Liu S, Cao X, Wu Z, Deng S, Fu H, Wang Y, et al. TREM2 improves neurological dysfunction and attenuates neuroinflammation, TLR signaling and neuronal apoptosis in the acute phase of intracerebral hemorrhage. Front Aging Neurosci. 2022;14:967825. https://doi.org/10.3389/fnagi.2022.967825
[42] Ferrara SJ, Chaudhary P, DeBell MJ, Marracci G, Miller H, Calkins E, et al. TREM2 is thyroid hormone regulated making the TREM2 pathway druggable with ligands for thyroid hormone receptor. Cell Chem Biol. 2022;29(2):239–248.e4. https://doi.org/10.1016/j.chembiol.2021.11.005
[43] Song NN, Yu JY, Wang C, Wu XQ, Ma GZ, Yuan XY, et al. Research progress in the pathogenesis of cognitive dysfunction in white matter hyperintensities: A narrative review. J Integr Neurosci. 2025;24(2):24840. https://doi.org/10.31083/j.jin2402484
[44] Huang H, Song W, Wang P, Zhu Y, Zheng L, Shen C, et al. White matter hyperintensities: cerebral small-vessel diseases and white matter microstructural impairments. iRadiology. 2025;3(1):5–25. https://doi.org/10.1002/ird3.121
[45] Raz N, Yang Y, Dahle CL, Land S. Volume of white matter hyperintensities in healthy adults: contribution of age, vascular risk factors, and inflammation-related genetic variants. Biochim Biophys Acta Mol Basis Dis. 2012;1822(3):361–369. https://doi.org/10.1016/j.bbadis.2011.08.007
[46] Balistreri CR, Monastero R. Neuroinflammation and neurodegenerative diseases: how much do we still not know? Brain Sci. 2023;14(1):19. https://doi.org/10.3390/brainsci14010019
[47] Zhong Y, Huang L, Cai S, Zhang Y, von Deneen KM, Ren A, et al. Altered effective connectivity patterns of the default mode network in Alzheimer's disease: an fMRI study. Neurosci Lett. 2014;578:171–175. https://doi.org/10.1016/j.neulet.2014.06.043
[48] Sabayan B, Westendorp RG, van der Grond J, Stott DJ, Sattar N, van Osch MJ, et al. Markers of endothelial dysfunction and cerebral blood flow in older adults. Neurobiol Aging. 2014;35(2):373–377. https://doi.org/10.1016/j.neurobiolaging.2013.08.020
[49] Ashby JW, Mack JJ. Endothelial control of cerebral blood flow. Am J Pathol. 2021;191(11):1906–1916. https://doi.org/10.1016/j.ajpath.2021.02.023
[50] Ueno M, Tomimoto H, Akiguchi I, Wakita H, Sakamoto H. Blood–brain barrier disruption in white matter lesions in a rat model of chronic cerebral hypoperfusion. J Cereb Blood Flow Metab. 2002;22(1):97–104. https://doi.org/10.1097/00004647-200201000-00012
[51] Rosenberg GA. Inflammation and white matter damage in vascular cognitive impairment. Stroke. 2009;40(3 Suppl 1):S20–S23. https://doi.org/10.1161/STROKEAHA.108.533133
[52] Hainsworth AH, Minett T, Andoh J, Forster G, Bhide I, Barrick TR, et al. Neuropathology of white matter lesions, blood–brain barrier dysfunction, and dementia. Stroke. 2017;48(10):2799–2804. https://doi.org/10.1161/STROKEAHA.117.018101
[53] Glushakova OY, Johnson D, Hayes RL. Delayed increases in microvascular pathology after experimental traumatic brain injury are associated with prolonged inflammation, blood–brain barrier disruption, and progressive white matter damage. J Neurotrauma. 2014;31(13):1180–1193. https://doi.org/10.1089/neu.2013.3080
[54] Hamilton OKL, Backhouse EV, Janssen E, Jochems ACC, Maher C, Ritakari TE, et al. Cognitive impairment in sporadic cerebral small vessel disease: a systematic review and meta-analysis. Alzheimers Dement. 2021;17(4):665–685. https://doi.org/10.1002/alz.12221
[55] van Dinther M, Voorter PH, Zhang E, van Kuijk SM, Jansen JF, van Oostenbrugge RJ, et al. The neurovascular unit and its correlation with cognitive performance in patients with cerebral small vessel disease: a canonical correlation analysis approach. GeroScience. 2024;46(5):5061–5073. https://doi.org/10.1007/s11357-024-01235-8
[56] Harrison BJ, Shaw M, Yücel M, Purcell R, Brewer WJ, Strother SC, et al. Functional connectivity during Stroop task performance. Neuroimage. 2005;24(1):181–191. https://doi.org/10.1016/j.neuroimage.2004.08.033
[57] Belghali M, Statsenko Y, Laver V. Stroop switching card test: brief screening of executive functions across the lifespan. Aging Neuropsychol Cogn. 2022;29(1):14–33. https://doi.org/10.1080/13825585.2020.1844865
[58] Heyder K, Suchan B, Daum I. Cortico-subcortical contributions to executive control. Acta Psychol (Amst). 2004;115(2–3):271–289. https://doi.org/10.1016/j.actpsy.2003.12.010
[59] Elliott R. Executive functions and their disorders. Br Med Bull. 2003;65(1):49–59. https://doi.org/10.1093/bmb/65.1.49
[60] Jones DK, Leemans A. Diffusion tensor imaging. Methods Mol Biol. 2011;711:127–144. https://doi.org/10.1007/978-1-61737-992-5_6
[61] Alexander AL, Lee JE, Lazar M, Field AS. Diffusion tensor imaging of the brain. Neurotherapeutics. 2007;4(3):316–329. https://doi.org/10.1016/j.nurt.2007.05.011
 Figures
 References
 Peer
Peer Information
Figure 1. Group comparisons of Whole brain CBF (A), GM CBF(B), WM CBF(C). Abbreviations: HC: healthy control; WMH: white matter hyperintensity; CBF: Cerebral Blood Flow; GM: Gray Matter; WM: White Matter; *: p < 0.05.
Figure 2. Partial correlation analyses were conducted between serum sTREM2 levels and whole brain CBF (A), gray matter (GM) CBF (B), and white matter (WM) CBF (C) in the HC group, and between sTREM2 levels and whole brain CBF (D), GM CBF (E), and WM CBF (F) in the WMH group, with sex, age, and years of education included as covariates. The results revealed a positive correlation between sTREM2 levels and GM CBF in the HC group (B), and a negative correlation in the WMH group (E). No significant correlations were observed between sTREM2 levels and whole brain CBF or WM CBF in either group (A, C, D, F). See Figure 2 for details. Abbreviations: sTREM2: soluble triggering receptor expressed on myeloid cells 2; HC: healthy control; WMH: white matter hyperintensity; CBF: Cerebral Blood Flow; GM: Gray Matter; WM: White Matter.
Figure 3. Partial correlation analyses were performed between GM CBF and MMSE (A), and MoCA (B) in the HC group, and between GM CBF and MMSE (C), and MoCA (D) in the WMH group, with sex, age, and years of education included as covariates. No significant correlations were found between GM CBF and MMSE (A) or MoCA (B) in the HC group. In contrast, positive correlations were observed between GM CBF and both MMSE (C) and MoCA (D) in the WMH group. See Figure 3 for details. Abbreviations: MMSE: Mini-Mental State Examination; MoCA: Montreal Cognitive Assessment; HC: healthy control; WMH: white matter hyperintensity; CBF: Cerebral Blood Flow; GM: Gray Matter; WM: White Matter.
[1] Shi Y, Toga AW. Connectome imaging for mapping human brain pathways. Mol Psychiatry. 2017;22(9):1230–1240. https://doi.org/10.1038/mp.2017.92
[2] Zotin MCZ, Sveikata L, Viswanathan A, Yilmaz P. Cerebral small vessel disease and vascular cognitive impairment: from diagnosis to management. Curr Opin Neurol. 2021;34(2):246–257. https://doi.org/10.1097/WCO.0000000000000913
[3] Mu R, Qin X, Guo Z, Meng Z, Liu F, Zhuang Z, et al. Prevalence and consequences of cerebral small vessel diseases: a cross-sectional study based on community people plotted against 5-year age strata. Neuropsychiatr Dis Treat. 2022;18:499–512. https://doi.org/10.2147/NDT.S352651
[4] Markus HS, de Leeuw FE. Cerebral small vessel disease: recent advances and future directions. Int J Stroke. 2023;18(1):4–14. https://doi.org/10.1177/17474930221144911
[5] Quinn TJ, Makin S, Doubal F, Staals J. Cerebral small vessel disease and vascular cognitive impairment. In: Touyz RM, Delles C, editors. Textbook of Vascular Medicine. Cham: Springer; 2019. p. 449–459. https://doi.org/10.1007/978-3-030-16481-2_42
[6] Bahrani AA, Powell DK, Yu G, Johnson ES, Jicha GA, Smith CD. White matter hyperintensity associations with cerebral blood flow in elderly subjects stratified by cerebrovascular risk. J Stroke Cerebrovasc Dis. 2017;26(4):779–786. https://doi.org/10.1016/j.jstrokecerebrovasdis.2016.10.017
[7] Ishibashi M, Kimura N, Aso Y, Matsubara E. Effects of white matter lesions on brain perfusion in patients with mild cognitive impairment. Clin Neurol Neurosurg. 2018;168:7–11. https://doi.org/10.1016/j.clineuro.2018.02.030
[8] Stewart CR, Stringer MS, Shi Y, Thrippleton MJ, Wardlaw JM. Associations between white matter hyperintensity burden, cerebral blood flow and transit time in small vessel disease: an updated meta-analysis. Front Neurol. 2021;12:647848. https://doi.org/10.3389/fneur.2021.647848
[9] Crane DE, Black SE, Ganda A, Mikulis DJ, Nestor SM, Donahue MJ, et al. Gray matter blood flow and volume are reduced in association with white matter hyperintensity lesion burden: a cross-sectional MRI study. Front Aging Neurosci. 2015;7:131. https://doi.org/10.3389/fnagi.2015.00131
[10] O’Sullivan M, Lythgoe DJ, Pereira AC, Summers PE, Jarosz JM, Williams SC, et al. Patterns of cerebral blood flow reduction in patients with ischemic leukoaraiosis. Neurology. 2002;59(3):321–326. https://doi.org/10.1212/WNL.59.3.321
[11] Crane DE, Black SE, Ganda A, Mikulis DJ, Nestor SM, Donahue MJ, et al. Gray matter blood flow and volume are reduced in association with white matter hyperintensity lesion burden: a cross-sectional MRI study. Front Aging Neurosci. 2015;7:131. https://doi.org/10.3389/fnagi.2015.00131
[12] Kim CM, Alvarado RL, Stephens K, Wey HY, Wang DJJ, Leritz EC, et al. Associations between cerebral blood flow and structural and functional brain imaging measures in individuals with neuropsychologically defined mild cognitive impairment. Neurobiol Aging. 2020;86:64–74. https://doi.org/10.1016/j.neurobiolaging.2019.10.023
[13] Ten Dam VH, van den Heuvel DMJ, de Craen AJM, Bollen ELEM, Murray HM, Westendorp RGJ, et al. Decline in total cerebral blood flow is linked with increase in periventricular but not deep white matter hyperintensities. Radiology. 2007;243(1):198–203. https://doi.org/10.1148/radiol.2431052111
[14] Brickman AM, Zahra A, Muraskin J, Steffener J, Holland CM, Habeck C, et al. Reduction in cerebral blood flow in areas appearing as white matter hyperintensities on magnetic resonance imaging. Psychiatry Res Neuroimaging. 2009;172(2):117–120. https://doi.org/10.1016/j.pscychresns.2008.11.006
[15] Wardlaw JM, Doubal FN, Valdés-Hernández M, Wang X, Chappell FM, Shuler K, et al. Blood–brain barrier permeability and long-term clinical and imaging outcomes in cerebral small vessel disease. Stroke. 2013;44(2):525–527. https://doi.org/10.1161/STROKEAHA.112.669994
[16] Li Y, Li M, Zhang X, Shi Q, Yang S, Fan H, et al. Higher blood–brain barrier permeability is associated with higher white matter hyperintensities burden. J Neurol. 2017;264(7):1474–1481. https://doi.org/10.1007/s00415-017-8550-8
[17] Gupta N, Simpkins AN, Hitomi E, Dias C, Leigh R, NIH Natural History of Stroke Investigators. White matter hyperintensity-associated blood-brain barrier disruption and vascular risk factors. J Stroke Cerebrovasc Dis. 2018;27(2):466–471. https://doi.org/10.1016/j.jstrokecerebrovasdis.2017.09.026
[18] Feng M, Wen H, Xin H, Wang S, Gao Y, Sui C, et al. Decreased local specialization of brain structural networks associated with cognitive dysfunction revealed by probabilistic diffusion tractography for different cerebral small vessel disease burdens. Mol Neurobiol. 2024;61(1):326–339. https://doi.org/10.1007/s12035-023-03597-0
[19] Tuladhar AM, Tay J, van Leijsen EMC, Lawrence AJ, van Uden IWM, Bergkamp MI, et al. Structural network changes in cerebral small vessel disease. J Neurol Neurosurg Psychiatry. 2020;91(2):196–203. https://doi.org/10.1136/jnnp-2019-321767
[20] Wan S, Dandu C, Han G, Guo Y, Ding Y, Song H, et al. Plasma inflammatory biomarkers in cerebral small vessel disease: a review. CNS Neurosci Ther. 2023;29(2):498–515. https://doi.org/10.1111/cns.14047
[21] Boehme AK, McClure LA, Zhang Y, Luna JM, Del Brutto OH, Benavente OR, et al. Inflammatory markers and outcomes after lacunar stroke: levels of inflammatory markers in treatment of stroke study. Stroke. 2016;47(3):659–667. https://doi.org/10.1161/STROKEAHA.115.012166
[22] Zhong L, Chen XF, Wang T, Wang Z, Liao C, Wang Z, et al. Soluble TREM2 induces inflammatory responses and enhances microglial survival. J Exp Med. 2017;214(3):597–607. https://doi.org/10.1084/jem.20160844
[23] Yang J, Fu Z, Zhang X, Xiong M, Meng L, Zhang Z, et al. TREM2 ectodomain and its soluble form in Alzheimer's disease. J Neuroinflammation. 2020;17:204. https://doi.org/10.1186/s12974-020-01878-2
[24] Park SH, Lee EH, Kim HJ, Jo S, Lee S, Seo SW, et al. The relationship of soluble TREM2 to other biomarkers of sporadic Alzheimer's disease. Sci Rep. 2021;11:13050. https://doi.org/10.1038/s41598-021-92101-6
[25] Rauchmann BS, Schneider-Axmann T, Alexopoulos P, Perneczky R, Alzheimer's Disease Neuroimaging Initiative. CSF soluble TREM2 as a measure of immune response along the Alzheimer's disease continuum. Neurobiol Aging. 2019;74:182–190. https://doi.org/10.1016/j.neurobiolaging.2018.10.022
[26] Rachmian N, Medina S, Cherqui U, Akiva H, Deitch D, Edilbi D, et al. Identification of senescent, TREM2-expressing microglia in aging and Alzheimer's disease model mouse brain. Nat Neurosci. 2024;27(6):1116–1124. https://doi.org/10.1038/s41593-024-01620-8
[27] Tsai HH, Chen YF, Yen RF, Lo YL, Yang KC, Jeng JS, et al. Plasma soluble TREM2 is associated with white matter lesions independent of amyloid and tau. Brain. 2021;144(11):3371–3380. https://doi.org/10.1093/brain/awab332
[28] Kwon HS, Lee EH, Park HH, Jin JH, Choi H, Lee KY, et al. Early increment of soluble triggering receptor expressed on myeloid cells 2 in plasma might be a predictor of poor outcome after ischemic stroke. J Clin Neurosci. 2020;73:215–218. https://doi.org/10.1016/j.jocn.2020.02.016
[29] Wu C, Ma YH, Hu H, Zhao B, Tan L, Alzheimer's Disease Neuroimaging Initiative. Soluble TREM2, Alzheimer's disease pathology, and risk for progression of cerebral small vessel disease: a longitudinal study. J Alzheimers Dis. 2023;92(1):311–322. https://doi.org/10.3233/JAD-220731
[30] Ma LZ, Tan L, Bi YL, Shen XN, Xu W, Ma YH, et al. Dynamic changes of CSF sTREM2 in preclinical Alzheimer's disease: the CABLE study. Mol Neurodegener. 2020;15:25. https://doi.org/10.1186/s13024-020-00374-8
[31] van Lengerich B, Zhan L, Xia D, Chan D, Joy D, Park JI, et al. A TREM2-activating antibody with a blood–brain barrier transport vehicle enhances microglial metabolism in Alzheimer's disease models. Nat Neurosci. 2023;26(3):416–429. https://doi.org/10.1038/s41593-022-01240-0
[32] Ruganzu JB, Zheng Q, Wu X, He Y, Peng X, Jin H, et al. TREM2 overexpression rescues cognitive deficits in APP/PS1 transgenic mice by reducing neuroinflammation via the JAK/STAT/SOCS signaling pathway. Exp Neurol. 2021;336:113506. https://doi.org/10.1016/j.expneurol.2020.113506
[33] Su R, Zhou T. Alpha-synuclein induced immune cells activation and associated therapy in Parkinson’s disease. Front Aging Neurosci. 2021;13:769506. https://doi.org/10.3389/fnagi.2021.769506
[34] Zhang J, Liu Y, Zheng Y, Luo Y, Du Y, Zhao Y, et al. TREM-2-p38 MAPK signaling regulates neuroinflammation during chronic cerebral hypoperfusion combined with diabetes mellitus. J Neuroinflammation. 2020;17(1):2. https://doi.org/10.1186/s12974-019-1688-9
[35] Folstein MF, Anthony JC, Parhad I, Duffy B, Gruenberg EM. The meaning of cognitive impairment in the elderly. J Am Geriatr Soc. 1985;33(4):228–235. https://doi.org/10.1111/j.1532-5415.1985.tb07109.x
[36] Bergeron D, Flynn K, Verret L, Poulin S, Bouchard RW, Bocti C, et al. Multicenter validation of an MMSE‐MoCA conversion table. J Am Geriatr Soc. 2017;65(5):1067–1072. https://doi.org/10.1111/jgs.14779
[37] Putcha D, Brickhouse M, Wolk DA, Dickerson BC. Fractionating the Rey Auditory Verbal Learning Test: Distinct roles of large-scale cortical networks in prodromal Alzheimer's disease. Neuropsychologia. 2019;129:83–92. https://doi.org/10.1016/j.neuropsychologia.2019.03.015
[38] Scarpina F, Tagini S. The Stroop color and word test. Front Psychol. 2017;8:557. https://doi.org/10.3389/fpsyg.2017.00557
[39] Wei M, Shi J, Li T, Ni J, Zhang X, Li Y, et al. Diagnostic accuracy of the Chinese version of the Trail-Making Test for screening cognitive impairment. J Am Geriatr Soc. 2018;66(1):92–99. https://doi.org/10.1111/jgs.15135
[40] Leung JL, Lee GT, Lam Y, Chan RC, Wu JY. The use of the Digit Span Test in screening for cognitive impairment in acute medical inpatients. Int Psychogeriatr. 2011;23(10):1569–1574. https://doi.org/10.1017/S1041610211001167
[41] Liu S, Cao X, Wu Z, Deng S, Fu H, Wang Y, et al. TREM2 improves neurological dysfunction and attenuates neuroinflammation, TLR signaling and neuronal apoptosis in the acute phase of intracerebral hemorrhage. Front Aging Neurosci. 2022;14:967825. https://doi.org/10.3389/fnagi.2022.967825
[42] Ferrara SJ, Chaudhary P, DeBell MJ, Marracci G, Miller H, Calkins E, et al. TREM2 is thyroid hormone regulated making the TREM2 pathway druggable with ligands for thyroid hormone receptor. Cell Chem Biol. 2022;29(2):239–248.e4. https://doi.org/10.1016/j.chembiol.2021.11.005
[43] Song NN, Yu JY, Wang C, Wu XQ, Ma GZ, Yuan XY, et al. Research progress in the pathogenesis of cognitive dysfunction in white matter hyperintensities: A narrative review. J Integr Neurosci. 2025;24(2):24840. https://doi.org/10.31083/j.jin2402484
[44] Huang H, Song W, Wang P, Zhu Y, Zheng L, Shen C, et al. White matter hyperintensities: cerebral small-vessel diseases and white matter microstructural impairments. iRadiology. 2025;3(1):5–25. https://doi.org/10.1002/ird3.121
[45] Raz N, Yang Y, Dahle CL, Land S. Volume of white matter hyperintensities in healthy adults: contribution of age, vascular risk factors, and inflammation-related genetic variants. Biochim Biophys Acta Mol Basis Dis. 2012;1822(3):361–369. https://doi.org/10.1016/j.bbadis.2011.08.007
[46] Balistreri CR, Monastero R. Neuroinflammation and neurodegenerative diseases: how much do we still not know? Brain Sci. 2023;14(1):19. https://doi.org/10.3390/brainsci14010019
[47] Zhong Y, Huang L, Cai S, Zhang Y, von Deneen KM, Ren A, et al. Altered effective connectivity patterns of the default mode network in Alzheimer's disease: an fMRI study. Neurosci Lett. 2014;578:171–175. https://doi.org/10.1016/j.neulet.2014.06.043
[48] Sabayan B, Westendorp RG, van der Grond J, Stott DJ, Sattar N, van Osch MJ, et al. Markers of endothelial dysfunction and cerebral blood flow in older adults. Neurobiol Aging. 2014;35(2):373–377. https://doi.org/10.1016/j.neurobiolaging.2013.08.020
[49] Ashby JW, Mack JJ. Endothelial control of cerebral blood flow. Am J Pathol. 2021;191(11):1906–1916. https://doi.org/10.1016/j.ajpath.2021.02.023
[50] Ueno M, Tomimoto H, Akiguchi I, Wakita H, Sakamoto H. Blood–brain barrier disruption in white matter lesions in a rat model of chronic cerebral hypoperfusion. J Cereb Blood Flow Metab. 2002;22(1):97–104. https://doi.org/10.1097/00004647-200201000-00012
[51] Rosenberg GA. Inflammation and white matter damage in vascular cognitive impairment. Stroke. 2009;40(3 Suppl 1):S20–S23. https://doi.org/10.1161/STROKEAHA.108.533133
[52] Hainsworth AH, Minett T, Andoh J, Forster G, Bhide I, Barrick TR, et al. Neuropathology of white matter lesions, blood–brain barrier dysfunction, and dementia. Stroke. 2017;48(10):2799–2804. https://doi.org/10.1161/STROKEAHA.117.018101
[53] Glushakova OY, Johnson D, Hayes RL. Delayed increases in microvascular pathology after experimental traumatic brain injury are associated with prolonged inflammation, blood–brain barrier disruption, and progressive white matter damage. J Neurotrauma. 2014;31(13):1180–1193. https://doi.org/10.1089/neu.2013.3080
[54] Hamilton OKL, Backhouse EV, Janssen E, Jochems ACC, Maher C, Ritakari TE, et al. Cognitive impairment in sporadic cerebral small vessel disease: a systematic review and meta-analysis. Alzheimers Dement. 2021;17(4):665–685. https://doi.org/10.1002/alz.12221
[55] van Dinther M, Voorter PH, Zhang E, van Kuijk SM, Jansen JF, van Oostenbrugge RJ, et al. The neurovascular unit and its correlation with cognitive performance in patients with cerebral small vessel disease: a canonical correlation analysis approach. GeroScience. 2024;46(5):5061–5073. https://doi.org/10.1007/s11357-024-01235-8
[56] Harrison BJ, Shaw M, Yücel M, Purcell R, Brewer WJ, Strother SC, et al. Functional connectivity during Stroop task performance. Neuroimage. 2005;24(1):181–191. https://doi.org/10.1016/j.neuroimage.2004.08.033
[57] Belghali M, Statsenko Y, Laver V. Stroop switching card test: brief screening of executive functions across the lifespan. Aging Neuropsychol Cogn. 2022;29(1):14–33. https://doi.org/10.1080/13825585.2020.1844865
[58] Heyder K, Suchan B, Daum I. Cortico-subcortical contributions to executive control. Acta Psychol (Amst). 2004;115(2–3):271–289. https://doi.org/10.1016/j.actpsy.2003.12.010
[59] Elliott R. Executive functions and their disorders. Br Med Bull. 2003;65(1):49–59. https://doi.org/10.1093/bmb/65.1.49
[60] Jones DK, Leemans A. Diffusion tensor imaging. Methods Mol Biol. 2011;711:127–144. https://doi.org/10.1007/978-1-61737-992-5_6
[61] Alexander AL, Lee JE, Lazar M, Field AS. Diffusion tensor imaging of the brain. Neurotherapeutics. 2007;4(3):316–329. https://doi.org/10.1016/j.nurt.2007.05.011
Peer-review Terminology
Identity transparency: Single anonymized
Reviewer interacts with: Editor
Details
This is an open access article under the terms of the Creative Commons Attribution License(http://creativecommons.org/licenses/by/4.0/), which permits use, distribution and reproduction in any medium, provided the original work is properly cited.
Publication History
Received 2025-04-05
Accepted 2025-05-10
Published 2025-05-15