


Abstract
Objective:To investigate the genetic causal association and shared molecular
mechanisms between hyperuricemia (HUA) and peripheral atherosclerosis using Mendelian
randomization (MR) and bioinformatics approaches, providing a theoretical basis for
early disease screening and intervention.
Methods:An MR strategy was employed. Based on Genome-Wide Association Study
(GWAS) datasets, the causal relationship between HUA and peripheral atherosclerosis was
assessed through instrumental variable selection, multi-model MR analysis (including
Inverse-Variance Weighted, IVW), and sensitivity analysis validation. Simultaneously,
relevant datasets from the GEO database were utilized to identify differentially
expressed genes (DEGs) common to both diseases. Gene Ontology (GO) and Kyoto
Encyclopedia of Genes and Genomes (KEGG) enrichment analyses were performed, and a
Protein-Protein Interaction (PPI) network was constructed to identify hub genes. Immune
infiltration characteristics were analyzed using CIBERSORT.
Results: A significant positive causal association was found between
hyperuricemia and atherosclerosis (OR=1.296, 95% CI: 1.112-1.512, P=0.0009).
Bioinformatics analysis identified 133 intersecting DEGs, which were enriched in
immune-inflammatory-related functions and pathways. Hub genes screened from the PPI
network included IL1B, CD86, and CSF1R. Immune infiltration analysis revealed
characteristic remodeling of the immune microenvironment in both groups.
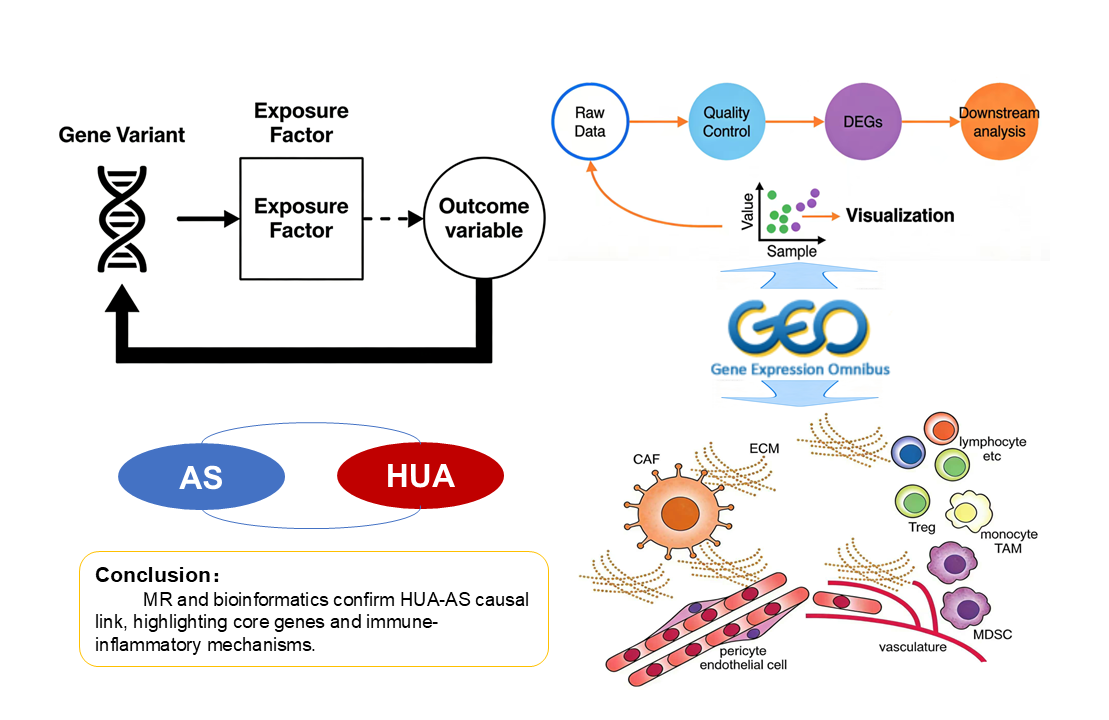
Conclusion:A significant positive genetic causal association exists between HUA
and peripheral atherosclerosis. The shared pathogenic mechanisms may involve the
aforementioned hub genes, activation of immune-inflammatory pathways, and abnormal
immune infiltration. The findings provide a theoretical framework and potential
experimental targets for early risk prediction and targeted intervention in HUA
complicated with peripheral atherosclerosis.
Keywords:Hyperuricemia; Atherosclerosis; Mendelian randomization; Bioinformatics; Hub targets; Immune infiltration
Introduction
Hyperuricemia (HUA) is a metabolic disorder characterized by excessive uric acid production or impaired excretion, and its prevalence has been rising globally, making it a significant public health concern [1] . As the underlying pathological basis for the onset of gout, HUA not only leads to joint inflammation and tissue damage but has also been confirmed by numerous clinical studies to exhibit a significant correlation with the occurrence and progression of cardiovascular diseases. It is an independent risk factor for cardiovascular events such as hypertension and coronary heart disease [2] . Atherosclerosis (AS) serves as the central pathological mechanism underlying cardiovascular diseases, characterized primarily by endothelial dysfunction, abnormal lipid deposition, and chronic inflammatory responses. Peripheral atherosclerosis, in particular, can lead to distal limb ischemia, necrosis, and even amputation, severely impairing patients' quality of life while imposing a substantial burden on healthcare systems [3,4] .
Currently, the association between HUA and peripheral atherosclerosis has been preliminarily confirmed by several observational studies. However, such studies are susceptible to interference from confounding factors such as age, obesity, and dyslipidemia, and cannot exclude reverse causality bias, making it difficult to determine whether a direct genetic causal relationship exists between them [5] . At the molecular mechanism level, existing research suggests that inflammatory responses may be a key mechanism mediating their comorbidity [6] . Nevertheless, the specific regulatory pathways, core effector genes, and characteristics of immune microenvironment remodeling have not been fully elucidated. This lack of clarity contributes to the absence of specific early screening indicators and targeted intervention strategies for the co-occurrence of HUA and peripheral atherosclerosis in clinical practice.
Mendelian randomization (MR) leverages the random allocation of genetic variants, effectively minimizing confounding factors and reverse causation bias, thereby providing high-quality evidence for elucidating genetic causal relationships between diseases [7] . Bioinformatics technology, through systematic mining of gene expression data from public databases, enables comprehensive analysis of disease-related differentially expressed genes (DEGs), core regulatory targets, and key signaling pathways, offering crucial support for clarifying the molecular mechanisms underlying comorbidities. Building on this, the present study integrates MR analysis and bioinformatics techniques. On one hand, it aims to validate the genetic causal association between HUA and peripheral atherosclerosis. On the other hand, it seeks to identify shared DEGs, core genes, and critical pathways between the two conditions, and to decipher immune infiltration characteristics. This research aims to provide a theoretical foundation and potential experimental targets for early risk prediction and targeted intervention of HUA comorbid with peripheral atherosclerosis, while also offering new perspectives for mechanistic research into "inflammatory-metabolic comorbidities."
Materials and Methods
This study comprised two main modules: Mendelian randomization (MR) analysis and bioinformatics analysis. Using HUA as the exposure and peripheral atherosclerosis as the outcome, we aimed to validate their causal relationship. Subsequently, we integrated relevant datasets for HUA and peripheral atherosclerosis from the Gene Expression Omnibus (GEO) database. This integration facilitated the identification of comorbidity-related differentially expressed genes (DEGs), core regulatory targets, and key pathways. Furthermore, immune infiltration analysis was incorporated to elucidate the underlying molecular mechanisms.
Mendelian Randomization Analysis Data SourcesIn this study, serum urate levels were defined as the exposure factor, and atherosclerosis as the outcome variable. All genome-wide association study (GWAS) summary datasets were retrieved from the IEU OpenGWAS project (https://gwas.mrcieu.ac.uk). The GWAS dataset for serum urate (ID: ebi-a-GCST90018977) was derived from an analysis of 343,836 individuals of European ancestry, which included 19,041,286 single nucleotide polymorphisms (SNPs) [8] .
The GWAS dataset for peripheral atherosclerosis (ID: finn-b-DM_PERIPHATHERO) comprised 216,666 European individuals and 16,380,247 SNPs. The original GWAS studies received approval from their respective institutional ethics committees, and all participants provided written informed consent.
Selection of Instrumental VariablesThis study employed single nucleotide polymorphisms (SNPs) as instrumental variables for the Mendelian randomization (MR) analysis, adhering to the three core MR assumptions (relevance, independence, and exclusion restriction) [9] . The selection process was conducted as follows: Initially, SNPs significantly associated with serum urate levels (a proxy for HUA) were identified (inclusion threshold: P < 5×10⁻⁸). To ensure independence among the selected instruments, a clumping procedure was applied using a linkage disequilibrium (LD) threshold of r² < 0.001 within a 10,000 kb window. The strength of each instrumental variable was assessed using the F-statistic (calculated as F=β² / SE², where β is the allele effect size and SE is its standard error) [10] . SNPs with an F-statistic less than 10, indicating potential weak instrument bias, were excluded. Furthermore, palindromic SNPs were removed to prevent strand ambiguity and analysis bias. Subsequently, the MR-PRESSO package was utilized to detect and remove outlier SNPs, thereby enhancing the robustness and reliability of the instrumental variable set.
Statistical Analysis for Mendelian RandomizationAll MR analyses were performed using R software with the TwoSampleMR package. The primary analytical method was the inverse-variance weighted (IVW) approach under a random-effects model, which was used to estimate the causal effect of serum urate levels on peripheral atherosclerosis. The combined odds ratio (OR) and its 95% confidence interval (CI) were derived by integrating the causal estimates from individual single nucleotide polymorphisms (SNPs), and these results served as the primary evidence for the causal inference. To complement the primary analysis and assess the robustness of the findings, several sensitivity analyses were conducted, including the weighted median method (which provides consistent estimates even if a proportion of the instrumental variables are invalid), the weighted mode method, the simple mode method, and MR-Egger regression (which can simultaneously detect and adjust for potential directional pleiotropy). A two-sided P-value of less than 0.05 was considered statistically significant for all analyses.
Sensitivity AnalysisTo ensure the robustness of the Mendelian randomization (MR) results, a comprehensive set of sensitivity analyses was conducted. Heterogeneity among the instrumental variables was assessed using Cochran's Q test; a P-value of less than 0.05 indicated the presence of heterogeneity, in which case the inverse-variance weighted (IVW) estimates were derived using a random-effects model. The potential for horizontal pleiotropy was evaluated via the MR-Egger intercept test, with a P-value greater than 0.05 suggesting no significant evidence of pleiotropic bias. Prior to the main analyses, the MR-PRESSO package was employed to identify and remove outlier SNPs. The results from the random-effects IVW method were considered primary. A funnel plot was generated to visually inspect the symmetry of effect estimates from individual SNPs, providing an additional check for potential bias. Finally, a leave-one-out analysis was performed by iteratively removing each SNP to determine whether the overall causal estimate was unduly driven by any single influential genetic variant, thereby confirming the stability and reliability of the conclusion.
Bioinformatics Analysis Data Acquisition and PreprocessingThe Gene Expression Omnibus (GEO, http://www.ncbi.nlm.nih.gov/geo) was systematically queried using the keywords "hyperuricemia" and "atherosclerosis" to identify relevant datasets. The inclusion criteria were defined as follows: (1) availability of both patient and healthy control groups with maximized sample sizes; (2) utilization of samples derived from human tissues; and (3) exclusion of samples involved in drug or therapeutic clinical trials. In accordance with these criteria, datasets GSE160170 and GSE43292 were selected as discovery sets, while GSE28829 was designated as the external independent validation set. Specifically, GSE160170 comprised peripheral blood mononuclear cells (PBMCs) from patients with HUA alongside age- and gender-matched healthy controls, capturing the systemic immune and metabolic status associated with HUA. Meanwhile, GSE43292 included atherosclerotic plaque tissues from patients with peripheral atherosclerosis and paired adjacent normal arterial wall tissues, providing insights into the local pathological microenvironment of vascular lesions. The validation set, GSE28829, consisted of 16 samples of advanced atherosclerotic plaque and 13 samples of early atherosclerotic plaque. All datasets underwent uniform preprocessing procedures, including background correction, quantile normalization, and probe-to-gene annotation conversion. Differentially expressed genes (DEGs) were identified independently within the two discovery sets, while the validation set was exclusively utilized to confirm the expression trends of key hub genes.
Identification of Differentially Expressed Genes (DEGs)DEGs corresponding to HUA and peripheral atherosclerosis were extracted from the GSE160170 and GSE43292 mRNA datasets, respectively, using the "limma" R package. For both the HUA and peripheral atherosclerosis datasets, genes with an adjusted P-value < 0.05 and an absolute log2 fold change (|logFC|) ≥ 0.6 were considered differentially expressed. The overlapping genes between the two DEG lists were identified using a Venn diagram.
Functional Enrichment Analysis of DEGsTo investigate the biological functions and signaling pathways associated with the common key genes, enrichment analyses were performed based on the Gene Ontology (GO) and Kyoto Encyclopedia of Genes and Genomes (KEGG) databases. GO annotation encompasses three domains: Biological Process (BP), Cellular Component (CC), and Molecular Function (MF). The GO functional and KEGG pathway enrichment analyses for this gene set were conducted using the "clusterProfiler" package in R, with a significance threshold set at P < 0.05.
Protein-Protein Interaction Network and Identification of Hub GenesA protein-protein interaction (PPI) network was constructed based on the overlapping differentially expressed genes (DEGs) using the STRING database (version 12.0). The resulting network was then imported into Cytoscape software (version 3.9.1) for visualization and further analysis. Hub genes within the network were identified using the cytoHubba plugin, employing the Maximal Clique Centrality (MCC) algorithm. The top 10 genes ranked by the MCC score were selected as candidate hub genes for subsequent analysis.
Validation of Hub Genes in External DatasetTo validate the robustness of hub genes identified from the discovery sets, the independent external GEO dataset GSE28829 was selected as the validation cohort. This dataset comprises peripheral blood gene expression profiles from peripheral atherosclerosis patients and healthy controls, ensuring tissue-type consistency with the discovery sets for direct comparability. All samples underwent uniform preprocessing using the identical pipeline applied to the discovery sets, including background correction, normalization, and probe-to-gene annotation matching. Differential expression of the 10 hub genes between peripheral atherosclerosis patients and healthy controls was subsequently analyzed using the "limma" R package. Statistical significance was defined as P < 0.05, and expression patterns were visualized using box plots.
Analysis of Immune Cell Infiltration and Spearman Correlation Between Hub Genes and Immune CellsImmune cell infiltration analysis: The CIBERSORT algorithm was used to estimate the relative abundance of 22 immune cell types in each sample from the discovery sets; only samples with a CIBERSORT output P < 0.05 were retained for subsequent analysis. Stacked bar charts were used to show the composition of immune cells, and box plots were used to compare the abundance differences of immune cells between the disease group and control group (Wilcoxon rank-sum test, P < 0.05 was considered significant).
Spearman correlation analysis between hub genes and immune cells: The expression levels of the top 10 hub genes and the abundance data of 22 immune cell types in the discovery sets were extracted, and Spearman rank correlation analysis was used to calculate the correlation coefficient (r) and significance (P-value) between them. With P < 0.05 as the significance threshold, the "pheatmap" R package was used to draw the correlation heatmap (Figure F corresponds to the hyperuricemia group, Figure H corresponds to the atherosclerosis group); the color intensity of the heatmap indicates the magnitude of the correlation coefficient, and significance marks (P<0.05, P<0.01, P<0.001) were labeled.
Results
Mendelian Randomization Analysis ResultsFollowing adherence to standard instrumental variable selection criteria, 236 independent single nucleotide polymorphisms (SNPs) were ultimately selected for the two-sample Mendelian randomization (MR) analysis to investigate the causal relationship between HUA and peripheral atherosclerosis. To validate compliance with MR assumptions, horizontal pleiotropy was evaluated using MR Egger regression. The initial analysis yielded an intercept estimate of 0.00017 (P = 0.95), with no significant evidence of directional pleiotropy—this was further confirmed by a consistent MR Egger intercept test result (intercept = 0.0002, P = 0.95), supporting the validity of subsequent causal estimates.
Causal associations were assessed via five complementary MR methods: inverse-variance weighted (IVW), MR Egger regression, weighted median estimator (WME), simple mode, and weighted mode. Cochran's Q test revealed substantial heterogeneity across SNPs (Q = 311, P < 0.01), prompting the use of the random-effects IVW model. Results from all five methods were directionally concordant, with the primary random-effects IVW analysis demonstrating a significant positive causal association between HUA and peripheral atherosclerosis (odds ratio [OR]=1.296, P < 0.001) (Table 1).
Table 1. Results of the TwoSample Mendelian Randomization Analysis
|
method |
nsnp |
β |
pval |
OR (95%CI) |
|
MR Egger |
236 |
0.265 |
0.055 |
1.304 (0.995-1.708) |
|
Weighted median |
236 |
0.217 |
0.079 |
1.242 (0.974-1.583) |
|
Inverse variance weighted |
236 |
0.259 |
0.0009 |
1.296 (1.112-1.512) |
|
Simple mode |
236 |
0.191 |
0.479 |
1.210 (0.715-2.048) |
|
Weighted mode |
236 |
0.162 |
0.202 |
1.176 (0.917-1.508) |
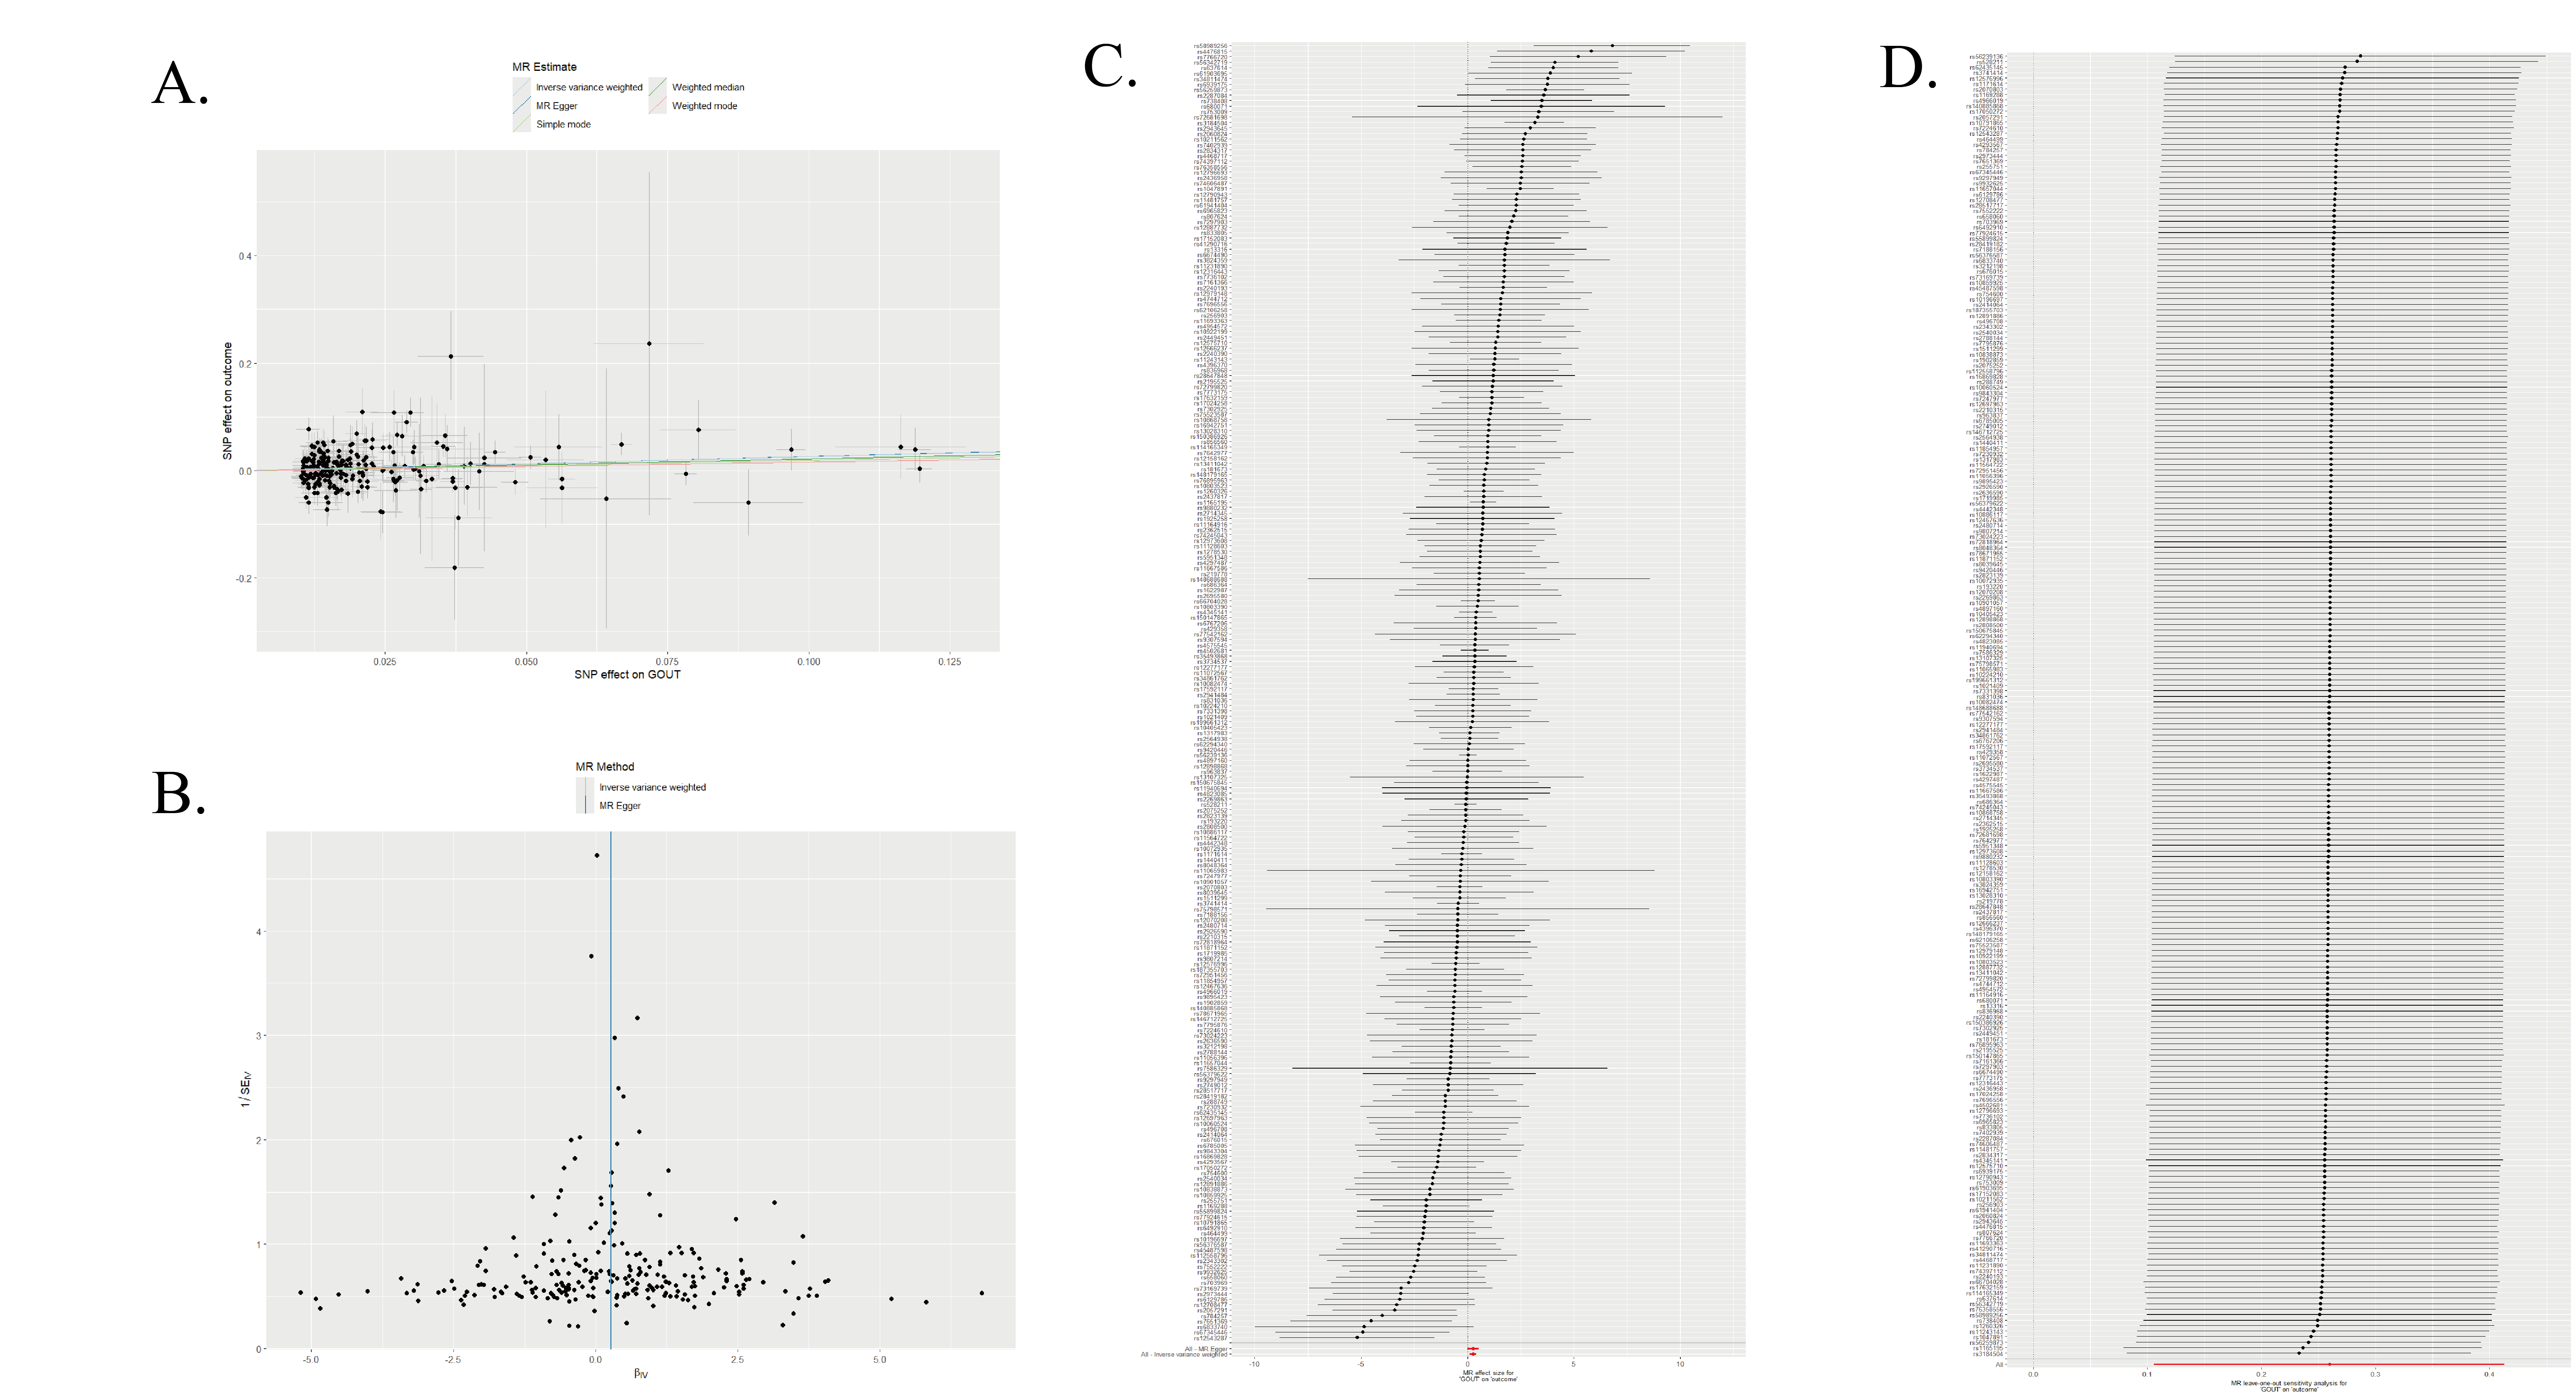
The scatter plot of the genetic associations is presented in Figure 1A. The funnel plot (Figure 1B) demonstrated approximate symmetry among the included SNPs, suggesting no obvious directional pleiotropy. A forest plot illustrating the individual causal estimates for each SNP is shown in Figure 1C. Furthermore, leave-one-out sensitivity analysis (Figure 1D) revealed that no single SNP disproportionately drove the overall causal estimate, supporting the robustness of the observed association.
Figure 1. (A) Scatter plot of the two-sample Mendelian randomization analysis; (B) Funnel plot of the two-sample Mendelian randomization analysis; (C) Forest plot showing the effect of individual SNPs on peripheral atherosclerosis (SNP: single nucleotide polymorphism); (D) Leave-one-out sensitivity analysis of SNPs.
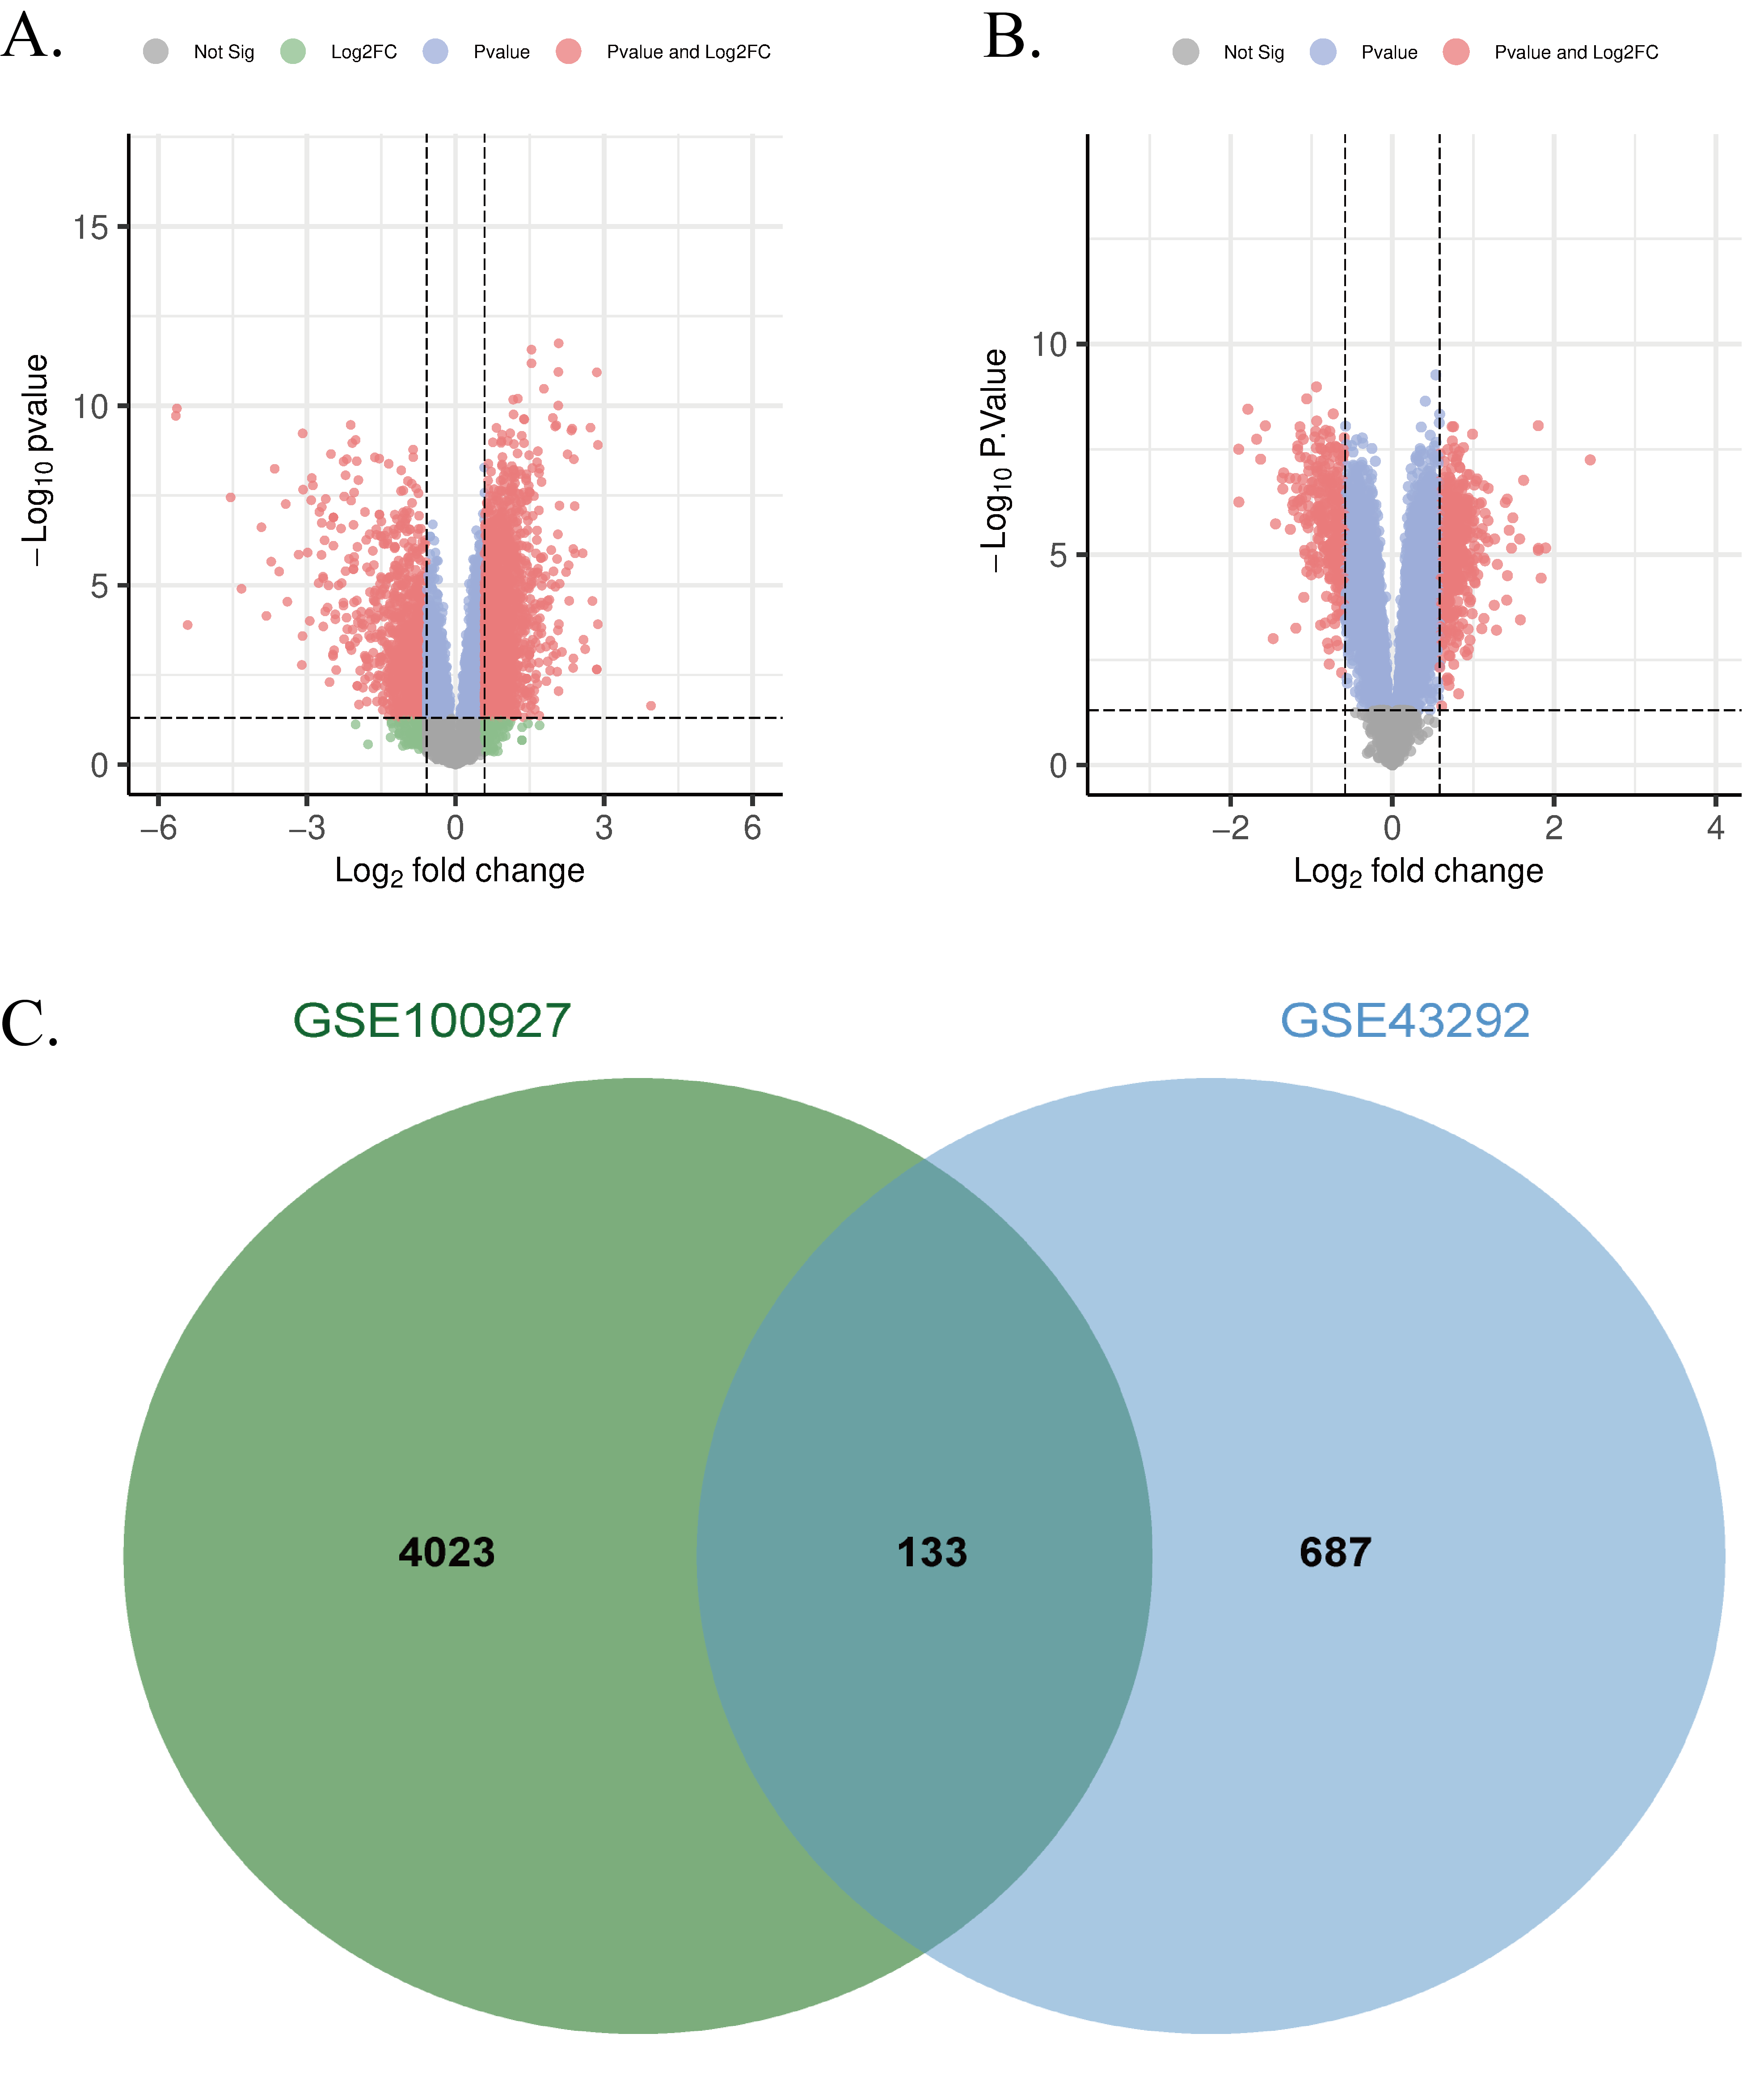
Following data preprocessing and application of the defined thresholds (adjusted P-value < 0.05 and |log2FC| ≥ 0.6), we identified 4,156 DEGs associated with HUA and 820 DEGs associated with peripheral atherosclerosis. A Venn analysis revealed 133 overlapping genes between the two sets.
Volcano plots visualizing the distribution of DEGs for the HUA and peripheral atherosclerosis datasets were generated using the 'ggplot2' package in R (Figures 2A and 2B, respectively). The overlap of DEGs between HUA and peripheral atherosclerosis was further illustrated using a Venn diagram created with the "VennDiagram" package (Figure 2C).
Figure 2. (A) Volcano plot of DEGs from the GSE160170; (D) Volcano plot of DEGs from the GSE43292; (E) Venn diagram of overlapping DEGs between GSE160170 and GSE43292.
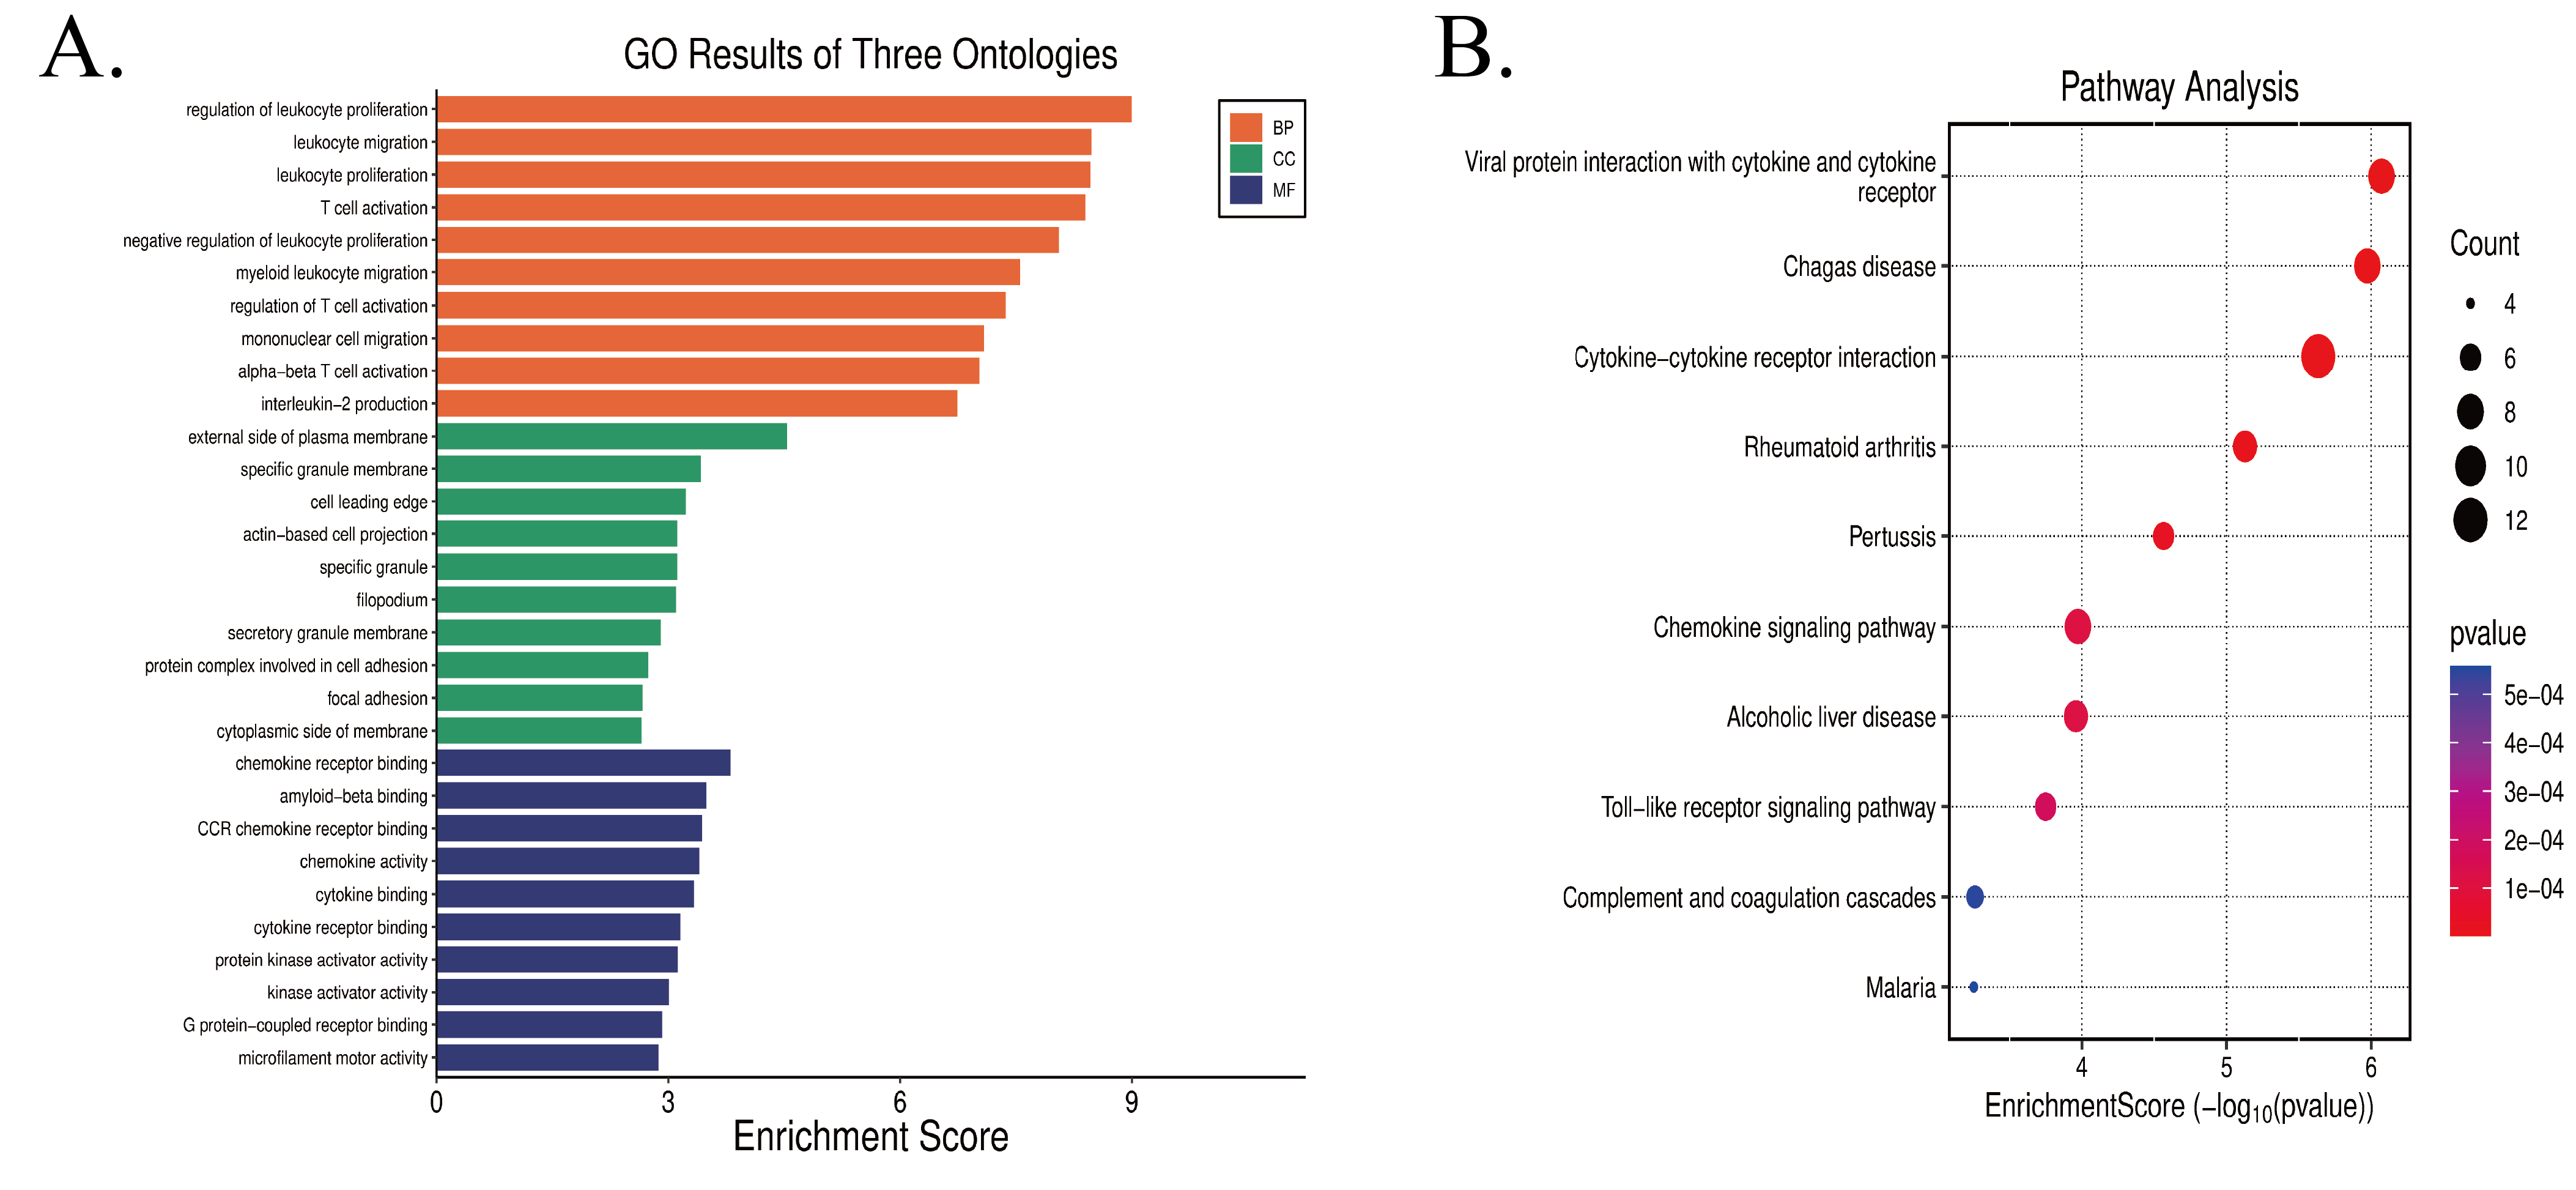
Enrichment analysis revealed significant terms across the three Gene Ontology (GO) domains, and representative results for each domain are visualized in Figure 3A. In the Biological Process (BP) category, the most significantly enriched term was "regulation of leukocyte proliferation". Other top-ranked terms included "leukocyte migration", "leukocyte proliferation", and "T cell activation", suggesting that these genes are predominantly involved in immune-related regulatory processes such as immune cell proliferation, migration, and T cell activation. For the Cellular Component (CC) domain, the genes were primarily enriched in locations such as the "external side of plasma membrane", "specific granule membrane", and "cell leading edge", indicating their functional roles in plasma membrane structures, granule-related components, and cellular leading edges. Within the Molecular Function (MF) category, the enriched genes were significantly associated with functions like "chemokine receptor binding", "amyloid-beta binding", and "CCR chemokine receptor binding", highlighting their crucial involvement in signaling processes related to chemokine receptor interactions and cytokine-associated molecular binding.
KEGG pathway analysis identified several pathways significantly associated with the overlapping target genes. The top 10 enriched pathways were selected for visualization (Figure 3B). The results revealed that these pathways were primarily involved in immune-inflammatory responses (e.g., Cytokine-cytokine receptor interaction, Chemokine signaling pathway, Toll-like receptor signaling pathway, Complement and coagulation cascades), infectious diseases (e.g., Chagas disease, Pertussis, Malaria), as well as pathways related to viral protein interactions with cytokines and cytokine receptors, autoimmune disorders (e.g., Rheumatoid arthritis), and alcoholic liver disease.
Figure 3. (A) Results of Gene Ontology (GO) enrichment analysis; (B) Results of Kyoto Encyclopedia of Genes and Genomes (KEGG) enrichment analysis.
The constructed protein-protein interaction (PPI) network comprised 133 key target nodes connected by 724 interaction edges. The top three hub genes, ranked by node degree, were IL1B (degree = 37), CD86 (degree = 32), and CSF1R (degree = 31). The overall PPI network is visualized in Figure 4. Furthermore, the Maximal Clique Centrality (MCC) algorithm within the CytoHubba plugin was employed to identify the most interconnected core module of the network. This analysis yielded a densely connected core subnetwork consisting of 10 nodes and 90 edges, specifically including the genes IL7R, CCL3, CD80, CXCL8, CD69, CCR2, IL1B, CD86, FCGR3A, and CSF1R.
Figure 4. Protein-protein interaction (PPI) network of proteins encoded by differentially expressed genes.

In the external independent validation set GSE28829, the expression trends of the 10 hub genes were fully consistent with those in the discovery set. As shown in Figure 5 (box plots of the 10 hub genes), each subplot corresponds to one hub gene (namely IL7R, CCL3, CD80, CXCL8, CD69, CCR2, IL1B, CD86, FCGR3A, and CSF1R in sequence), with the P-value for differential expression between the peripheral atherosclerosis group and the control group indicated above each subplot. The expression patterns of these hub genes in HUA/peripheral atherosclerosis patients from the validation set completely aligned with those observed in the discovery set, confirming the stability and biological reliability of these hub genes.
Figure 5. Box plots of the 10 hub genes' expression in the external validation set GSE28829 (peripheral atherosclerosis group vs healthy control group).
The relative abundance of 22 canonical immune cell subsets across HUA and peripheral atherosclerosis discovery cohorts was deconvoluted using the CIBERSORT algorithm; samples with a deconvolution P-value <0.05 were included for subsequent analyses to ensure robustness. In the HUA cohort, box plot analysis (Figure 6A, Control vs. HUA) demonstrated significantly altered immune cell proportions, including markedly elevated eosinophil, activated mast cell, and monocyte compartments alongside diminished resting natural killer (NK) cell frequencies (all P<0.05). This heterogeneity was further illustrated in stacked bar plots (Figure 6B), which displayed the compositional variability of 22 immune subsets across individual samples. Hierarchical clustering of immune infiltration patterns (Figure 6E) effectively distinguished HUA patients from healthy controls, corroborating a disease-specific immune signature. Spearman correlation analysis (Figure 6F) revealed distinct positive and negative associations between top hub genes and immune subsets, with multiple hub genes exhibiting robust positive correlations with pro-inflammatory cell types, consistent with HUA's inflammatory pathogenesis. In the peripheral atherosclerosis cohort, box plot comparisons (Figure 6C, Atherosclerotic vs. Control) identified significantly increased memory B cell and M0 macrophage abundances, concomitant with reduced regulatory T (Treg) and activated NK cell populations (all P<0.05). Stacked bar plots (Figure 6D) depicted cohort-specific distribution heterogeneity, while hierarchical clustering (Figure 6G) segregated peripheral atherosclerosis patients from controls based on immune cell composition, reflecting a distinctive peripheral atherosclerosis-associated microenvironment remodeling pattern. Correlation heatmaps (Figure 6H) demonstrated AS-specific relationships between hub genes and immune subsets, notably positive correlations between key hub genes and pro-atherosclerotic populations such as M0 macrophages, thereby linking core genetic signatures to immune dysregulation in peripheral atherosclerosis pathogenesis.
Figure 6. Immune cell infiltration and hub gene-immune cell correlations in HUA and peripheral atherosclerosis. (A) Immune cell abundance box plot (HUA vs. control; Wilcoxon rank-sum test). (B) Immune cell composition stacked bar plot (HUA cohort). (C) Immune cell abundance box plot (peripheral atherosclerosis vs. control; Wilcoxon rank-sum test). (D) Immune cell composition stacked bar plot (peripheral atherosclerosis cohort). (E) Immune infiltration pattern heatmap (HUA vs. control). (F) Hub gene-immune cell Spearman correlation heatmap (HUA cohort). (G) Immune infiltration pattern heatmap (peripheral atherosclerosis vs. control). (H) Hub gene-immune cell Spearman correlation heatmap (peripheral atherosclerosis cohort).

Discussion
The integration of Mendelian randomization and bioinformatics analyses in this study provides robust evidence supporting a genetic causal relationship between HUA and peripheral atherosclerosis, alongside the identification of shared molecular mechanisms centered on immune-inflammatory activation. The MR results demonstrate that HUA significantly increases the risk of peripheral atherosclerosis (OR=1.296, P=0.0009), while the bioinformatics investigations reveal 133 overlapping differentially expressed genes enriched in immune-related pathways, with key hub genes such as IL1B, CD86, and CSF1R implicated in both conditions. Furthermore, immune infiltration profiling delineates distinct yet converging microenvironmental remodeling in HUA and peripheral atherosclerosis. Building upon these findings, the following sections interpret the clinical implications of the causal association, elucidate the potential roles of core genes and pathways, discuss immune dysregulation features, and outline future research directions.
Causal Relationship Between Hyperuricemia and Atherosclerosis: Clinical Implications of MR FindingsThe MR-derived causal association lends strong support to the pathogenic hypothesis that hyperuricemia promotes atherosclerosis via vascular endothelial injury. This mechanism is consistent with recent reviews indicating that hyperuricemia may induce endothelial dysfunction through dual pathways of oxidative stress and inflammatory activation, thereby serving as a contributing factor in the initiation of atherosclerotic progression [11] .
The clinical relevance of the Mendelian randomization (MR) findings substantiates the mechanistic paradigm that HUA contributes to atherosclerosis through the impairment of vascular endothelial function—a pathway increasingly emphasized in recent reviews [12,13] . Mechanistically, HUA is posited to induce endothelial dysfunction via dual interrelated pathways involving oxidative stress and inflammatory activation, thereby serving as an initiating factor in atherogenesis.
From a clinical practice perspective, this study provides key evidence for the prevention and control of cardiovascular risks in patients with primary HUA. Combined with previous research indicating the protective effect of urate-lowering therapy against coronary atherosclerosis [14] , it is recommended that patients with primary HUA (especially those with early-onset or recurrent disease) routinely undergo carotid artery ultrasound (to assess intima-media thickness, IMT) and lipid profile testing. Implementation of an "early screening - early intervention" strategy may delay the progression of atherosclerosis and reduce the risk of cardiovascular events.
Molecular Mechanisms of Comorbidity: The Role of Core Genes and Pathways via Integrative Bioinformatic AnalysisBioinformatic analysis demonstrated that the shared pathogenesis of hyperuricemia and atherosclerosis centers on immune-inflammatory pathways. Gene Ontology enrichment indicated that overlapping differentially expressed genes are primarily involved in immune cell activation, migration, and chemokine receptor binding, while Kyoto Encyclopedia of Genes and Genomes analysis confirmed concurrent activation of cytokine-cytokine receptor interaction, chemokine signaling, and complement-coagulation cascades. These findings suggest that immune-inflammatory responses and coagulation dysfunction synergistically exacerbate disease progression, forming a core molecular network underlying hyperuricemia-atherosclerosis comorbidity and providing a critical theoretical basis for targeted interventions.
Notably, the two discovery datasets differ in tissue origin, which endows the identified mechanisms with dual systemic-local attributes. Dataset GSE160170 comprises peripheral blood mononuclear cells from hyperuricemia patients and healthy controls, whereas GSE43292 consists of atherosclerotic plaque tissues paired with normal arterial wall tissues from atherosclerosis patients. Systemically, upregulated genes in peripheral blood mononuclear cells reflect hyperuricemia-related systemic immune activation, wherein circulating pro-inflammatory mediators impair vascular endothelial function and facilitate immune cell infiltration to prime atherosclerosis initiation [15] . Locally, activation of homologous pathways in plaque tissues drives proliferation, migration, and pro-inflammatory polarization of resident immune cells, particularly macrophages, thereby accelerating lipid deposition, plaque formation, and instability. Collectively, these cross-tissue shared pathways bridge hyperuricemia-induced systemic immune-metabolic disorders and atherosclerosis-associated local vascular lesions, establishing a bidirectional regulatory loop between systemic and pathological processes.
Based on the hub genes identified from the PPI network analysis, we further clarified direct mechanistic links between hyperuricemia-associated uric acid signaling and hub gene upregulation. IL1B, as a classical pro-inflammatory cytokine, is driven by urate crystal-induced NLRP3 inflammasome activation in monocytes and macrophages, which cleaves pro-IL1B into its biologically active form to drive excessive secretion. Elevated IL1B promotes vascular endothelial expression of adhesion molecules (e.g., VCAM-1, ICAM-1) to accelerate monocyte infiltration and induces macrophage polarization toward the pro-inflammatory M1 phenotype, exacerbating plaque instability [16,17] . CD86, a key costimulatory molecule on antigen-presenting cells, participates in regulating T cell activation and immune homeostasis. Its dysregulated expression disrupts this balance, aggravating immune-mediated joint damage in HUA through M1 macrophage polarization while concurrently promoting abnormal recruitment of inflammatory immune cells within atherosclerotic plaques via dysfunctional checkpoint signaling [18~20] . In addition, CXCL8, serving as a central hub gene, potently recruits neutrophils to trigger gout flares and is likely involved in chronic vascular inflammation during atherosclerosis [21] . CSF1R regulates macrophage survival and proliferation within atherosclerotic plaques, and its expression is upregulated by inflammatory mediators generated in the setting of endothelial dysfunction. In the study by Thayaparan et al., endothelial dysfunction establishes a pro-inflammatory microenvironment that enhances CSF1R signaling, thereby driving macrophage-dependent abdominal aortic aneurysm formation. This CSF1R-mediated expansion and sustained survival of macrophages promotes plaque progression, lipid accumulation, and vascular remodeling, collectively contributing to macrophage-driven plaque pathogenesis [22] . CCR2 mediates monocyte migration and represents a key step in the infiltration of inflammatory cells into the arterial wall [23] .
Furthermore, bioinformatics analysis of the discovery sets not only confirmed that the shared pathogenesis of HUA and peripheral atherosclerosis centers on immune-inflammatory pathways but also gained robust support from the external independent validation set GSE28829 (Figure 5), which further underscores the biological significance of the aforementioned hub genes. All 10 hub genes remained significantly upregulated in this independent cohort, effectively excluding dataset-specific bias inherent to the discovery sets and validating these genes as stable core regulatory factors intricately involved in the pathological progression of HUA-peripheral atherosclerosis comorbidity. For instance, the sustained high expression of IL1B (P=0.0007) and CSF1R (P=4.9e-05) aligns perfectly with their pro-inflammatory functions elaborated earlier—driving local inflammation in HUA and promoting atherosclerotic plaque progression—and directly reinforces the mechanistic hypothesis that "immune-inflammatory factors orchestrate the development of comorbidity".
Mechanistic Implications of Immune Cell InfiltrationUtilizing the CIBERSORT algorithm, our immune infiltration analysis delineated distinct immune microenvironment characteristics between HUA and peripheral atherosclerosis. HUA was predominantly marked by an increase in innate immune and effector cells, including eosinophils, activated mast cells, and monocytes, coupled with a relative decrease in regulatory T cells. Conversely, peripheral atherosclerosis was characterized by an enrichment of memory B cells and M0 macrophages, alongside a decline in immunoregulatory subsets such as regulatory T cells and activated NK cells. These disparities illuminate the divergent patterns of inflammatory and immunoregulatory imbalance intrinsic to the two conditions, suggesting significant insights into their shared pathogenesis and potential targets for immunomodulatory therapies.
Our analysis of immune cell infiltration demonstrated notable remodeling characteristics in the immune microenvironments of HUA and peripheral atherosclerosis. Moreover, the Spearman correlation between hub genes and immune cells (Figures 6F, 6H) further elucidated the regulatory influence of core genes on immune cell behavior. For instance, the positive correlation of IL1B with monocytes and activated mast cells in the HUA group aligns with its role as a pro-inflammatory cytokine that drives local inflammation. Similarly, the correlation of CD86 with memory B cells and M0 macrophages in the peripheral atherosclerosis group is consistent with its known mechanism of regulating T cell activation and disrupting immune homeostasis.
These correlations not only substantiate the molecular network of "hub genes-immune inflammatory pathways-disease comorbidity" but also provide a clear direction for targeted interventions. For example, targeting CSF1R may potentially mitigate peripheral atherosclerosis plaque progression by inhibiting the accumulation of M0 macrophages, while regulating IL1B is anticipated to improve joint inflammation in HUA as well as vascular inflammation in peripheral atherosclerosis.
Innovations and Future DirectionsThe core innovation of this study lies in the integration of Mendelian randomization for causal inference and bioinformatic multi-omics analysis, which not only clarifies the causal relationship between HUA and atherosclerosis but also elucidates the underlying molecular mechanisms and immune characteristics. This approach effectively addresses the limitations of traditional observational studies, which are prone to confounding, and of standalone bioinformatic analyses, which lack causal validation. Future research should focus on four key directions: (1) conducting targeted interventions on hub genes such as IL1B and CD86 to evaluate their therapeutic potential in models of comorbidity; (2) performing multi-population GWAS analyses to explore race-specific molecular mechanisms; (3) integrating clinical cohorts to develop immune subtype-based risk prediction models, thereby supporting personalized diagnosis and treatment; and (4) implementing clinical intervention studies to assess the effects of urate-lowering and anti-inflammatory therapies on core pathways and immune infiltration profiles.
Study LimitationsThis study has several limitations. First, the MR analysis was based on data from European populations; therefore, the findings may exhibit population specificity and require validation in other ethnic groups. Second, the bioinformatics analysis relied solely on transcriptomic data from public databases, and the functional roles of the identified core genes and pathways lack experimental validation in vitro or in vivo. Third, the immune infiltration results were inferred from transcriptomic predictions and lack direct experimental corroboration (e.g., flow cytometry or immunohistochemistry). Fourth, therapeutic intervention factors were not incorporated, limiting our ability to assess their potential effects on disease comorbidity, which warrants investigation in future studies.
Conclusion
By integrating Mendelian randomization with multi-omics bioinformatics approaches, this study is the first to reveal a significant positive genetic causal link between hyperuricemia and atherosclerosis, and to systematically identify shared hub genes (e.g., IL1B, CD86, CSF1R) and immune-inflammatory pathways underlying their comorbidity. These findings provide a theoretical foundation and potential targets for early risk stratification and immunomodulatory interventions in patients with HUA complicated by peripheral atherosclerosis.
Abbreviations
Atherosclerosis : AS; Biological Process : BP; Cell type Identification By Estimating Relative Subsets Of RNA Transcripts : CIBERSORT; Cellular Component : CC; Confidence Interval : CI; Differentially Expressed Genes : DEGs; Gene Expression Omnibus : GEO; Gene Ontology : GO; Genome-Wide Association Study : GWAS; Hyperuricemia : HUA; Intercellular Adhesion Molecule 1 : ICAM-1; Inverse-Variance Weighted : IVW; Kyoto Encyclopedia of Genes and Genomes : KEGG; Linkage Disequilibrium : LD; Log2 Fold Change : logFC; Maximal Clique Centrality : MCC; Mendelian Randomization : MR; Mendelian Randomization Pleiotropy Residual Sum and Outlier : MR-PRESSO; Molecular Function : MF; Natural Killer : NK; NOD-Like Receptor Family Pyrin Domain Containing 3 : NLRP3; Odds Ratio : OR; Peripheral Blood Mononuclear Cells : PBMCs; Protein-Protein Interaction : PPI; Regulatory T Cell : Treg; Single Nucleotide Polymorphism : SNP; Vascular Cell Adhesion Molecule 1 : VCAM-1; Weighted Median Estimator : WME
Declarations
Author contributions
Mengmeng Sun: Conceptualization, Methodology, Formal analysis, Writing – original draft. Haoran Wang: Data curation, Investigation, Validation. Zhigong Zhang: Supervision, Project administration, Writing – review & editing.
Acknowledgement
Not Applicable.
Funding information
Not Applicable.
Ethics approval and consent to participate
Not Applicable.
Competing Interests
The authors declare that they have no existing or potential commercial or financial relationships that could create a conflict of interest at the time of conducting this study.
Data Availability
All data needed to evaluate the conclusions in the paper are present in the paper or the Supplementary Materials. Additional data related to this paper may be requested from the authors.
References
 Figures
 References
 Peer
Peer Information
Figure 1. (A) Scatter plot of the two-sample Mendelian randomization analysis; (B) Funnel plot of the two-sample Mendelian randomization analysis; (C) Forest plot showing the effect of individual SNPs on peripheral atherosclerosis (SNP: single nucleotide polymorphism); (D) Leave-one-out sensitivity analysis of SNPs.
Figure 2. (A) Volcano plot of DEGs from the GSE160170; (D) Volcano plot of DEGs from the GSE43292; (E) Venn diagram of overlapping DEGs between GSE160170 and GSE43292.
Figure 3. (A) Results of Gene Ontology (GO) enrichment analysis; (B) Results of Kyoto Encyclopedia of Genes and Genomes (KEGG) enrichment analysis.
Figure 4. Protein-protein interaction (PPI) network of proteins encoded by differentially expressed genes.
Figure 5. Box plots of the 10 hub genes' expression in the external validation set GSE28829 (peripheral atherosclerosis group vs healthy control group).
Figure 6. Immune cell infiltration and hub gene-immune cell correlations in HUA and peripheral atherosclerosis. (A) Immune cell abundance box plot (HUA vs. control; Wilcoxon rank-sum test). (B) Immune cell composition stacked bar plot (HUA cohort). (C) Immune cell abundance box plot (peripheral atherosclerosis vs. control; Wilcoxon rank-sum test). (D) Immune cell composition stacked bar plot (peripheral atherosclerosis cohort). (E) Immune infiltration pattern heatmap (HUA vs. control). (F) Hub gene-immune cell Spearman correlation heatmap (HUA cohort). (G) Immune infiltration pattern heatmap (peripheral atherosclerosis vs. control). (H) Hub gene-immune cell Spearman correlation heatmap (peripheral atherosclerosis cohort).
Peer-review Terminology
Identity transparency: Single anonymized
Reviewer interacts with: Editor
Details
This is an open access article under the terms of the Creative Commons Attribution License(http://creativecommons.org/licenses/by/4.0/), which permits use, distribution and reproduction in any medium, provided the original work is properly cited.
Publication History
Received 2025-12-07
Accepted 2026-02-21
Published 2026-03-31